Download
1 / 42
420 likes | 514 Views
SA long-term valuation bases. Presented to ASSA members 7 October 2003 – Johannesburg 9 October 2003 – Cape Town. Why are we here?. Display the information at the FSB’s disposal. Orientate members as to the industry trends in statutory returns. What will we show you?.

E N D
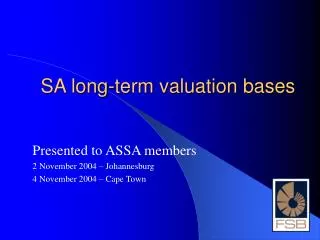
SA long-term valuation bases Presented to ASSA members 7 October 2003 – Johannesburg 9 October 2003 – Cape Town
Why are we here? • Display the information at the FSB’s disposal. • Orientate members as to the industry trends in statutory returns.
What will we show you? • Give you brief overview of the LT Insurance market in 2002. • Discuss the impact of management action to reduce the CAR of insurers. • Review some valuation assumptions in the LT2000 and compare these with the resulting AOS.
Overview of LT Insurance market in 2002 • FSB classification: • G – General insurers (30 active in 2002) • L – Linked insurers (12 active in 2002) • R – Reinsurers (5 active in 2002) • A – Assistance insurers (6 active in 2002) • N – Niche insurers (7 active in 2002) • C – Cell captive insurers (4 active in 2002)
Overview – remarks • Industry funding factor of 1.11 (excluding CAR). • Industry funding factor of 1.06 (including CAR). • Industry CAR cover of 2.18.
Management action in CAR • For the top 10 insurers, management action was used to reduce the investment resilience risk in the CAR by 65%. • We acknowledge the freedom of PGN104 in setting CAR requirements but we contrast this with the need for a prudent approach when setting statutory reserves.
Management action in CAR • Types of management actions used by the 10 biggest general insurers: • Removal of non-vested bonuses. • Removal of interim bonuses. • Declaration of lower future bonus rates. • Reduction in surrender values. • Revision of mortality and expense charges. • Reduction in second tier margins.
Valuation assumptions in the LT2000 • The results we are about to show represent a mix of greatly different insurers. • The dangers of interpreting industry results should be kept in mind. • We suggest the results to be an orientation exercise and nothing more.
Mortality - Assurance • Most popular table is the SA85/90. • SA72/77, SA56/62 and internal experience are also used. • The types of adjustments vary: • A form of proportional adjustment is most popular. • The addition of constants and age adjustments are also used.
Mortality - Assurance • The following is separate weighted average mortality rates for males and females as disclosed in statement G11. • Used a benchmark of SA85/90 ultimate 100% heavy to place weighted rates in perspective.
Mortality - Annuities • Most popular table is a(55). • SA56/62, PA(90) and own experience are also used. • The types of adjustments vary: • A form of proportional adjustment is most popular. • Improvement in mortality rates in the future and age adjustments are also used. • Used a benchmark of a(55) to put weighted average rates in perspective.
Morbidity – Income disability • Most popular table is GLTD. • SA85/90 and own experience are also used. • A proportional adjustment is often used. • Data for lump sum disability was fragmented. • We decided to omit results for lump sum disability.
Discount rates • Observed rates from 6% to 18% between the classes of business. • Observed inflation assumption between 2% and 11%. • Weighted average inflation assumption of 9.6%.
Questions? Thank you for your time Contact details: Hantie van Heerden (012) 422 2801 hantiev@fsb.co.za André Jansen van Vuuren (012) 428 8103 andrej@fsb.co.za