Download
1 / 25
250 likes | 321 Views
Medicare Prescription Drug Program and Using Part D Data for Research. Becky Briesacher, PhD Associate Professor, Medicine Division of Geriatric Medicine. Funding and COI.

E N D
Medicare Prescription Drug Program and Using Part D Data for Research Becky Briesacher, PhD Associate Professor, Medicine Division of Geriatric Medicine
Funding and COI • Supported by grants R01AG028745 and R01AG022362 from the National Institute on Aging (NIA), and the Harvard Pilgrim Health Care Foundation. Dr Briesacher is also supported by a Research Scientist Development Award from the NIA (K01AG031836. • I declare no conflict of interest.
"75% of older Americans lack decent, dependable, private-sector coverage of prescription drugs. That’s three out of every four seniors. To those who think prescription drug coverage isn’t a problem for most Medicare beneficiaries, I say, think again." President Bill ClintonJuly 1999
Career in Part D Research 1) identified high predictability of prescription drug expenditures from one year to the next2; 2) demonstrated selection into prescription drug coverage is also predictable, based almost exclusively on observable health status3; 3) created elasticity estimates that reducing medication costs by 10% would increase drug utilization by 5.4%-6.6%;3 and 4) established Part D effects differ in nursing home setting.
Overview of Presentation • Brief overview of Medicare Part D • Brief overview of Part D data • Description of Medicare Part D evaluation
History of Drug Coverage in Medicare • Medicare is health care insurance for elderly and disabled Americans since 1965 • Medicare had 2 notable coverage gaps: LTC and prescription drugs • Alternatives include employer/retiree benefits, self-purchased Medigap plans, Medicare HMO option, Medicaid for the poor, Military & VA • Medicare Catastrophic Coverage Act of 1988 – first prescription drug program in Medicare, repealed before implemented. • Part D passed in 2003 and implemented in 2006 • ~65%-80% of population had drug coverage in 2005
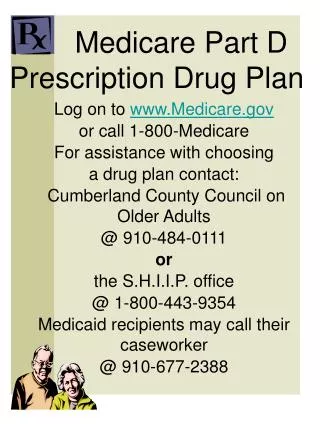
Medicare Part D Drug Benefit • Voluntary enrollment unless in Medicaid • Choose from dozens (~40) of private Rx coverage plans and Medicare Advantage organizations • premiums are heavily subsidized, late penalty for late enrollment • Auto-enrolled into Part D if in Medicaid
Prescription Drug Coverage Among Medicare Beneficiaries, 2009 Total Number of Medicare Beneficiaries = 45.2 Million No Drug Coverage 4.5million10% Stand-Alone Prescription Drug Plan Other Drug Coverage1 6.2million14% 17.5million39% Total in Part D Plans: 26.7 Million (59%) 7.9 million18% Retiree Drug Coverage2 Medicare AdvantageDrug Plan 9.2 million20% NOTE: Percentages do not sum to 100% due to rounding. 1Includes Veterans Affairs, retiree coverage without RDS, Indian Health Service, state pharmacy assistance programs, employer plans for active workers, Medigap, multiple sources, and other sources. 2Includes Retiree Drug Subsidy (RDS) coverage and FEHBP and TRICARE retiree coverage. SOURCE: Centers for Medicare & Medicaid Services, 2009 Enrollment Information (as of February 1, 2009).
Plan Pays 15%; Medicare Pays 80% 5% $6,154 in Total Drug Costs ($4,350 out-of-pocket) $3,454 Coverage Gap (“Doughnut Hole”) $2,700 in Total Drug Costs Enrollee Pays 25% Plan Pays 75% $295 Deductible Medicare’s “Standard” Drug Benefit in 2009 • … Most plans do not offer the “standard” benefit, and coverage varies across most dimensions, including: • Monthly premiums • Deductibles • The “doughnut hole” • Covered drugs and utilization management restrictions • Cost sharing for covered drugs
Part D data for research • Since June 2008, Part D data are available to researchers. • Chronic Condition Data Warehouse (CCW) contains 100% Part D data and is official data source. • CCW offers chronic disease indicators (21 conditions) to ID disease cohorts but has data on all Part D enrollees • Researchers may request random 10% or 20% sample • Part D data are linkable to other Medicare data
Part D data • Part D data include information about drug (NDC), cost, pharmacy, provider and benefit information • Data are de-identified to protect identity of beneficiary, prescriber, pharmacy and plan. • Researchers must select each variable and provide variable-level justification • Assistance offered through ResDAC
Part D data • Constructed variables “may not exactly represent the beneficiary experience at the time of the prescription fill.” • Part D data differ from pharmacy claims • Contains only final status record • Will not include drugs excluded from Part coverage or filled through 3rd party, or not filed as claim (e.g., 100% cash). • 2-year lag in availability E.g., OPTIMIZING CHRONIC DISEASE PREVENTION AND MANAGEMENT IN ADVANCED DEMENTIA R21HS019579-01: PI Tjia • $20,000, 9 month lag = Part D data linked to Part A, MDS, and OSCAR on 200,000 Medicare enrollees with end-stage dementia in NHs.
Part D Data available only on Part D enrollees Total Number of Medicare Beneficiaries = 45.2 Million, 2009 No Drug Coverage 4.5million10% Stand-Alone Prescription Drug Plan Other Drug Coverage1 6.2million14% 17.5million39% Total in Part D Plans: 26.7 Million (59%) 7.9 million18% Retiree Drug Coverage2 Medicare AdvantageDrug Plan 9.2 million20% NOTE: Percentages do not sum to 100% due to rounding. 1Includes Veterans Affairs, retiree coverage without RDS, Indian Health Service, state pharmacy assistance programs, employer plans for active workers, Medigap, multiple sources, and other sources. 2Includes Retiree Drug Subsidy (RDS) coverage and FEHBP and TRICARE retiree coverage. SOURCE: Centers for Medicare & Medicaid Services, 2009 Enrollment Information (as of February 1, 2009).
Medicare Part D and Changes in Prescription Drug Use and Cost Burden: National Estimates for the Medicare Population, 2000-2007 Becky A. Briesacher, PhD (2) Yanfang Zhao, MA (4) Jeanne Madden, PhD (1) Fang Zhang, PhD (1) Alyce S. Adams, PhD (3) Jennifer Tjia, MD, MSCE (2) Dennis Ross-Degnan, ScD (1) Jerry H. Gurwitz, MD (2) Stephen B. Soumerai, ScD (1) Harvard Medical School and Harvard Pilgrim Health Care Institute; Div of Geriatric Medicine, Meyers Primary Care Institute and UMass Medical School; Kaiser Permanente Division of Research; Duke Translational Nursing Institute, Duke University School of Nursing
Evaluations of Medicare Part D • Previous evaluations used • Pharmacy chain data • Regional Medicare Advantage plan data • Important gap in research on Part D to date: • Lack of nationally-representative evaluations
Study DesignOverall Methods • Examined study outcomes over 8 years (2000-2007) • Compared actual post-Part D (2006-2007) outcomes to projected values (using 2000-2005 data) • Projections based on time-series regressions and parametric bootstrapping techniques and 10,000 simulations of post-Part D outcomes. • Standardized estimates by fixing population characteristics • Subgroup analyses -- by demographic & health status • 3-year continuous cohort for sensitivity analyses
Study DesignData from MCBS • CMS conducts the Medicare Current Beneficiary Survey • Since 1991, continuous face-to-face panel survey • 3-year rotating panels • >12,000 community-dwelling and institutionalized, elderly and disabled per year • Rich variety of measures: • Demographics, income, assets, living arrangements, family supports, health status and functioning • Health insurance and drug coverage • Utilization of services – self-reported and FFS claims • Costs, copayments, deductibles • Access to medical care, satisfaction • Medications self-reported and Part D data, beginning in 2006
Study DesignSample and Variables • Community-dwelling Medicare enrollees, 2000-2007 • ~11.5K persons/year; total unique individuals, n = 38,777 • Study Variables: • Prescription fills and OOP costs • from MCBS Cost and Use file • self-reported fills (disregarding Part D claims) • Prescription drug coverage • categorized by coverage status between 2005 and 2007 • no drug coverage in all three years • gained drug coverage after Part D (in 2006 or 2007) • had drug coverage in all three years
Annual Drug Use and Out-of-Pocket Drug Costsunadjusted means for overall population, 2000-2007 Prescription Drug Fills OOP Drug Costs Medical Care. 49(9):834-41, 2011 Sep.
Changes in Annual Rx Fills and OOP Drug Costs Following Part D Implementation (overall population) • Standardization to hold 2000 population characteristics stable • Predictions used autoregressive models based on 2000-2005 historical trends • Confidence intervals were constructed by creating 10,000 simulated outcomes using bootstrap method Medical Care. 49(9):834-41, 2011 Sep.
Subgroup Analyses: Annual Prescription Drug Fills absolute differences between observed and predicted means Medical Care. 49(9):834-41, 2011 Sep.
Subgroup Analyses: Annual OOP Drug Costs absolute differences between observed and predicted means Medical Care. 49(9):834-41, 2011 Sep.
Changes in Annual Fills and OOP Rx Costs among 3-year Cohorts, by Insurance Status, 2005-2007 Mean Rx Fills Mean Rx OOP Costs Gained drug coverage after Part D Always had drug coverage Medical Care. 49(9):834-41, 2011 Sep.
My Current Part D Research • NIH-National Institute on Aging (R01AG028745) (Co-Investigator) Changes in Cardiovascular Care and Outcomes in Eight Years after Medicare Part D • Developing R01 to conduct clinical trial on Part D enrollment protocols in nursing home setting