Download

1 / 42
420 likes | 591 Views
Tropical Cyclone Forecasts. Dr. Richard J. Murnane Risk Prediction Initiative Bermuda Biological Station for Research, Inc. 2 1 0. Hurricane Landfall per Year. 1910 1930 1950 1970 1990. Year. Cat 1&2. Cat 3, 4, 5. Hurricane Landfall in Miami and Dade County. Landsea, 1997.

E N D
Tropical Cyclone Forecasts Dr. Richard J. Murnane Risk Prediction Initiative Bermuda Biological Station for Research, Inc.
2 1 0 Hurricane Landfall per Year 1910 1930 1950 1970 1990 Year Cat 1&2 Cat 3, 4, 5 Hurricane Landfall in Miami and Dade County Landsea, 1997
Tropical Cyclone Seasonal Forecasting Strategy • Identify predictable global and local features that drive climate • Statistically relate features to tropical cyclone occurrence
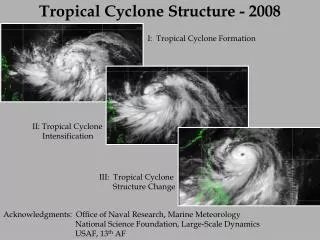
Outline • Background on tropical cyclones • Necessary conditions • Forecast parameters • Seasonal forecasts • Basin-wide • Landfall • Real-time hurricane intensity forecasts • Numerical prediction • Theoretical Maximum Potential Intensity
Necessary Conditions • Coriolis Effect • Unstable Atmosphere • Sea Surface Temperature > 26º C • Trigger • Little Vertical Wind Shear • High Relative Humidity
Major Climatic Features Affecting Atlantic Basin Hurricane Activity • El Niño-Southern Oscillation (ENSO) • Quasi-biennial Oscillation • Sea Surface Temperature (SST) • West Africa Rainfall • Atmospheric Zonal Wind Anomalies • Sea Level Atmospheric Pressure
Normal El Niño El Niño-Southern Oscillation Images from IRI web site
0.8 El Niño 0.6 Neutral El Viejo Probability 0.4 0.2 0.0 0 2 4 6 8 Number Landfalls Per Year US Hurricane Landfalls ³Cat. 3 J. O’Brien & COAPS
El Niño Neutral El Viejo Baroclinically InfluencedAtlantic Storms: Hurricane Landfalls/year 1.0 0.8 0.6 # Landfalls/year 0.4 0.2 0.0 Cat 1 Cat 2 Cat 3
El Niño Neutral El Viejo Tropical Only Atlantic Storms: Hurricane Landfalls/year 1.5 1.0 # Landfalls/year 0.5 0.0 Cat 1 Cat 2 Cat 3
East Phase West Phase SuppressedAtlantic Hurricane Formation Enhanced Atlantic Hurricane Formation Quasi-Biennial Oscillation (QBO) Arrows show stratospheric wind direction
Sea Surface Temperature Climate Prediction Center
Sea Surface Temperature Anomalies Climate Prediction Center
200 100 0 Oct Dec July Nov May Aug June Sept Jan-Apr Seasonal Atlantic Hurricane Activity (1886-1991)
Western Sahel Region Gulf of Guinea Region West African Rainfall
1900 1920 1940 1960 1980 Sahel Rain (1899 – 1990) 2 1 0 -1 -2 Standard Deviation Year Landsea et al., 1992
14.43 IHD Intense Hurricanes vs. Sahel Rain 1949 – 1990 0.64 IHD 7 Driest Sahel Years 7 Wettest Sahel Years Gray & Landsea, 1992
N. Atlantic SST Anomaly NE Atlantic SLP Anomaly (neg) Sahel Rain Intense Hurricane Days Long-term Trends 2 1 0 -1 -2 Standard Deviation 1950 1960 1970 1980 1990 Year Gray, 1998
Gray et al.’s Basin-wide Forecasts • Issued in: December, April, June, August • Forecast includes a variety of parameters: • Named Storms • Hurricanes, Hurricane Days • Intense Hurricanes, Intense Hurricane Days • Hurricane Destruction Potential • Net Tropical Cyclone Activity • Predictive Parameters Vary With Forecast
Elsner’s Atlantic Basin Forecasts • Uses subset of Gray variables • Zonal winds • West African rainfall • Divides storms into tropical only and baroclinically influenced • assumes climatology for baroclinically influenced storms (» 3 per year) • Predicts tropical only storms using OLS • Calculates intense hurricanes using Poisson regression
Elsner et al. Forecast 1998 Atlantic Intense Hurricanes 0 1 2 3 4 5 6£ Elsner et al., 1998
Gray Landfall Forecast • Divides coast into separate sections • Uses Atlantic Basin seasonal forecast of “Net Tropical Cyclone Activity” (NTC) and SST anomalies to calculate total landfall probability • Distributes total probability along coast based on landfall climatology
Cat 1&2 Hurricane Landfalls Gray, 1998
Intense Hurricane Landfalls Gray, 1998
1998 Landfall % Probability Forecast » 4 » 5 » 7 33 » 6 » 8 39 36 8 10.2 34 Gray, 1998
Elsner Landfall Probability Forecasts • Uses “Logistic Regression” for predictions • Predictors include: • Zonal wind anomalies • Sea level pressures • QBO • West African rainfall
1998 Location Forecast Elsner et al., 1998
NHC Intensity Forecasts (1990-97) 25 20 15 10 5 72 hours 48 hours Error (knots) 24 hours 1994 1993 1990 1991 1992 1995 1996 1997 Year Avila, 1998
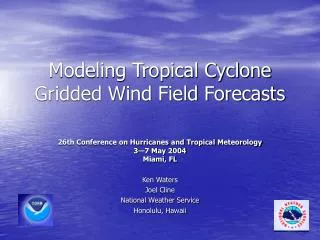
Ginis et al.’s Hurricane Forecasts • Based on Coupled Ocean-Atmosphere Model • Full Ocean Model Reproduces Air-Sea Interactions and Improves Intensity Forecasts
Hurricane Opal Ginis, 1998
Maximum Potential Intensity (MPI) • Developed by Emanuel and Bister • MPI Controlled by Environmental Factors, e.g.: • Sea Surface Temperature • Upper Atmosphere Temperature • Relative Humidity • Doesn’t account for forward motion
-100 -75 -50 -25 Upper Atmosphere Temperature (ºC) 15 20 25 30 35 40 45 Sea Surface Temperature (ºC) Contours of Maximum Wind Speed (m/s) Emanuel and Bister, 1998
Maximum Potential Winds (m/s) Emanuel and Bister, 1998
Maximum Potential Wind (knots) Emanuel and Bister, 1998
Conclusions • Many of the seasonal forecast parameters are related to the necessary conditions for tropical cyclone formation • Basin-wide seasonal forecasts are easier to make than landfall forecasts but they are of less relevance • Realistic representations of the ocean are needed to improve tropical cyclone intensity forecasts