Download
1 / 22
220 likes | 323 Views
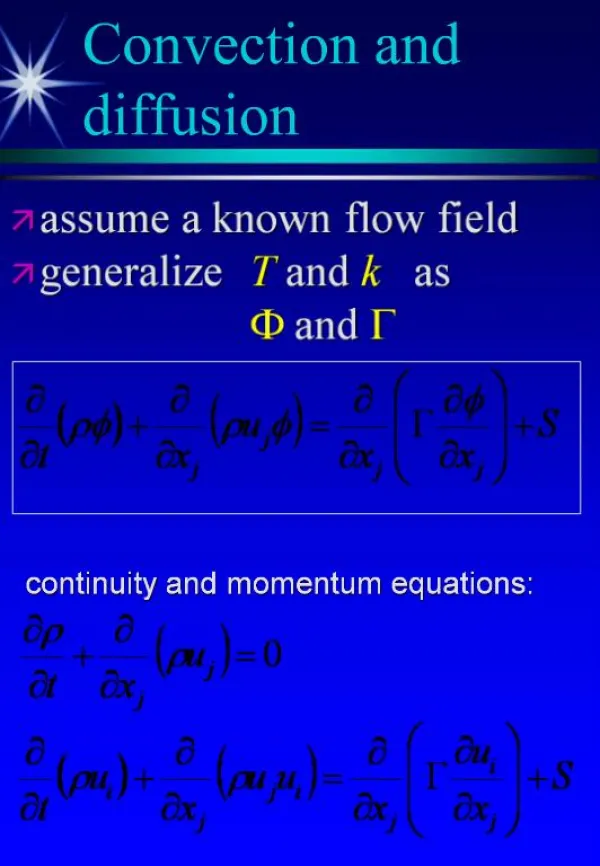
Aviation Verification and Convection. Chris Leonardi WFO RLX August 31, 2005. GPRA Goals. Most GPRA goals at the WFO level are associated with significant/severe weather.

E N D
Aviation Verification and Convection Chris Leonardi WFO RLX August 31, 2005
GPRA Goals • Most GPRA goals at the WFO level are associated with significant/severe weather. • As far as routine WFO products are concerned, there is a goal only for IFR aviation forecasts, and for day 1 precipitation threat scores. • NONE for temperature forecasts, you WRKVER worshippers!
Aviation GPRA goal • The FY2005 national goal for operational impact forecasts (more on this later) for IFR conditions is: • 0.46 POD • 0.68 FAR • Our stats for FY 2005 through 8/27: • 0.39 POD • 0.68 FAR …not horrible, but…
Stats breakdown • IFR stats from 6/1/05 to 8/27/05: • 0.29 POD • 0.76 FAR • Why are we doing worse? • Fog? • Convection? • Confusion over who gets the TAFs (H/J shift)? • Natural stat drop when changing regimes (ie. starting up the enhanced short-term program)? • The high ERA of the Red Sox bullpen? • Most of these reasons are probably at least partially responsible...but one problem appears to be easily fixable.
Stats breakdown • For which scheduled TAF (00Z, 06Z, 12Z, 18Z) did we have the worst IFR scores over the past few months (through 8/20)?
Stats breakdown • What kind of conclusions can we draw? • Doing the best on 06Z TAFs – when we expect the most fog • Doing the worst on 18Z TAFs (with an alarming FAR!) – when we expect the most convection • 12Z TAFs are second best (lingering fog) and 00Z TAFs are second worst (lingering convective chances plus incipient fog) Convection has been the bigger problem!
Stats • So how are these verification stats determined anyway? • Only scheduled TAFs (00Z, 06Z, 12Z, and 18Z) are tracked. This is to discourage ob-chasing. • The “operational impact” category forecast is evaluated against the current ob every 5 minutes. A contingency table is created from these evaluations and IFR POD/FAR are calculated from them…along with a TON of other stats. …so what is “operational impact???”
“Operational Impact” When no TEMPO or PROB forecasts are in effect, the operational impact (OI) forecast is the same as the prevailing forecast. When a TEMPO or PROB forecast is in effect, the OI forecast is defined as the forecast in effect that is most likely to impact operations.
OI and TEMPOs • If a TEMPO forecast is in effect, a 2-step process is used to find the OI forecast: • Step 1 - Variability test. The program looks for at least two changes in the observations +/- 90 minutes of the end of the 5-minute interval being evaluated. • Step 2 - If the variability test passed (two or more changes +/- 90 minutes), then the OI forecast is the forecast (prevailing or TEMPO) (a) closest categorically to the observation for ceiling, visibility, and flight category, or (b) closest in knots for wind speed and wind gusts.
OI and TEMPOs cont. • If the variability test failed, the OI forecast is defined as the most pessimistic of the two forecasts (e.g., lowest ceiling category, highest wind speed) This is what hurts our stats the most.
OI example Let’s look at a couple of scenarios from a recent day at RLX. - Both CRW/PKB TAFs have prevailing VFR with TEMPO IFR conditions in TSRA for the first 6 hours. - PKB receives a TSRA with IFR conditions from 1814Z to 1830Z…and is VFR during the remaining portion of the 6-hour period. - CRW gets no TSRA and remains VFR through the period (with plenty of CB/TCU around!) How would these TAFs be verified at 1900Z?
OI example for PKB PKB receives a TSRA with IFR conditions from 1814Z to 1830Z…and is VFR during the remaining portion of the 6-hour period At 1930Z…visibility is 10SM (VFR). Since there has been variability (2 category changes) in last 90 minutes, the forecast with the least amount of error is used. P6SM. A VFR hit! Note, though, that this does NOT help our IFR stats.
OI example for PKB • So when does the IFR forecast hit? At 1815Z, 1820Z, and 1825Z…three 5-minute intervals. • From 1945Z on, there is no longer any variability. Therefore, the most pessimistic forecast is used (2SM). EVERY 5-minute interval from 1945Z to 2400Z is an IFR miss… 51 of them.
OI example for CRW CRW gets no TSRA and remains VFR through the period. At 1930Z…vis is P6SM. The variability test fails, since there is no change +/- 90 minutes from this time. Therefore, the most pessimistic condition is used. 2SM. An IFR miss! In fact, during this period there were *72* IFR misses.
OI example stats • So, how do the combined IFR stats look for these two TAFs? • POD = 1.0 (since all 3 IFR occurrences were covered by an IFR forecast) • FAR = 0.98 (123 IFR misses, 3 IFR hits) • Also recorded 18 VFR hits • CSI = 0.02
What to do?? • So, it would seem statistically that it would behoove us to forecast IFR rarely…if ever…for convection • BUT…we want to provide good service to our customers and present the realm of possibilities. We need to find a way to balance service and verification as much as possible.
Some suggestions… • For the first 3 hours of a TAF: • If you feel/observe that IFR for convection is justified, pick the *most likely* hour and use a TEMPO during that hour. Otherwise…use CB or MVFR conditions. • This strategy will inform pilots of the risk, yet somewhat minimize the impact to our stats if there is a miss. Possible drawback…implied precision. • Yes, you may pick the wrong hour…but that is what amendments are for, AND at least the presence of such convection in the TAF will inform the users.
Some suggestions… • Between 3-6 hours of a TAF… • Use of IFR TEMPO groups for convection is STRONGLY discouraged…unless you have a clear justification (e.g. squall line). Even then, be *brief*. Monitor trends, and amend if needed. • Preferred method…use CB cloud groups, or a TEMPO MVFR thunder group (for a situation such as likely pops for popup convection)
Some suggestions… • Beyond 6 hours into a TAF… • Use of IFR TEMPO groups for convection is PROHIBITED (even though doing so would not affect our stats). • Use either a CB cloud group, or perhaps an MVFR TEMPO thunder group in a rare instance (well-timed strong cold front, for example).
Bottom line… • Be deterministic! • Focus on what WILL happen, not what COULD happen. • Use TEMPOs sparingly…keep them short and specific. • Be ESPECIALLY careful with convection. CB is your friend! • Check the stats occasionally, both yours and the office’s (instructions to come)
Aviation grids • Grids • Remember to do them! • Tool usage (more than just PredHgtFmModelRH) • Starting up visibility grids next week (prevailing vis, same time range) • Goal: become comfortable enough with grids/AVNFPS formatting to begin TAF generation from grids by early October