Download
1 / 35
350 likes | 351 Views
This evaluation assesses the realism of the European Centre for Medium-Range Weather Forecasts' Nature Run in terms of midlatitude cyclone activity and tropical weather systems in the Atlantic and African Monsoon regions. Statistical properties and diagnostic features are analyzed to identify trends, biases, and anomalies.

E N D
Evaluation of the European Centre for Medium-Range Weather Forecasts’ (ECMWF) Nature Run: midlatitude cyclone activity; tropical Atlantic and African Monsoon Reale, O, J. Terry, M. Masutani, L.P. Riishojgaard, E. Andersson, and J.C. Jusem
Assessing the NR realism: midlatitude systems versus tropical weather • Statistical properties of the atmospheric flow, particularly midlatitude cyclone activity, are investigated • In the tropics however, it is crucial the assess the presence of fundamental features of tropical weather systems • Until few years ago, to search for evidence of tropical weather in a global model was not possible and only large-scale, diluted large-scale features could be detected
3. Midlatitude Cyclone Diagnostics • Diagnostics produced: • Tracks • Lifespan • Distribution by central pressure • Deepening rate • Mean direction and speed (total, zonal and meridional speed) • Cyclone, genesis and lysis density • Goals: • Identify any trends or biases • Identify any conspicuous anomalies and determine source • Assess realism
2. Cyclone Tracking • Utilize Goddard’s cyclone tracking software (Terry and Atlas, AMS conf, Aug 1996): • Identifies and tracks mostly extratropical cyclones (cutoff at 20 deg N/S latitude) • Interfaces with GrADS contouring algorithm • Uses SLP field at 4hPa contour interval • Finds centroid of inner-most closed isobar • Tracks the centers using extrapolation and 500hPa steering • Cyclone tracks generated: • Nature run at one degree for Jun 2005 to May 2006 (each month and season) • NCEP operational analysis at one degree for 2000 to 2006 (each month, 68 of 84 months were available)
13. DJF Cyclogenesis density from NCEP reanalysis over Southern Hemisphere. (Simmonds and Keay, Journal of Climate, March 2000) JJA
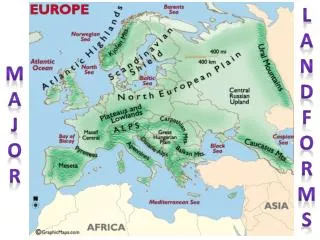
Searching for realistic tropical weather systems in the Tropical Atlantic region:a phenomenological approach • Statistical properties of midlatitude cyclone activity have been proved very satisfactory • Fundamental dynamical featuresassociated to the climate-weather interface generally present in the tropical atmosphere, are searched in the Nature Run. Focus is the AMMA region and the tropical Atlantic • African Easterly Jet, African Waves, Tropical Cyclones track (and their complexity), Tropical Cyclone structure are investigated • Reale, O., J. Terry, M. Masutani, E. Andersson, L. P. Riishojgaard, J. C. Jusem, 2007: Preliminary evaluation of the European Centre for Medium-Range Weather Forecasts (ECMWF) Nature Run over the Tropical Atlantic and African Monsoon region. Geophysical Research Letters, 34, L22810, doi:10.1029/2007GL31640.
The African Easterly Jet (AEJ) • Intensity (11m/s) compares well with observed climatology (e.g Burpee 1972 and operational analyses for the period) • Realistic clear separation between AEJ and low-level Harmattan flow • Realistically well-defined low level westerly flow • Moderate horizontal cyclonic shear on the southern flank of the AEJ, increasing towards the end of the analyzed period
The AEJ and the African Monsoon: seasonal evolution • July and August means show a northward displacement of the AEJ, gradual intensifcation of the Harmatthan flow and of the low-level monsoonal flow. • Realistically well-defined low level westerly monsoonal flow in agreement with obs (e.g. Asnani 2005) • Realistically intense horizontal cyclonic shear on the southern flank of the AEJ in July and Aug • Tropical Easterly Jet at 200-150 hPa is stronger than climatology, thus creating higher-than-observed vertical easterly shear, which appears to inhibit the early development of AEWs attempting to become vortices
The African Easterly Jet (AEJ) in September • The AEJ appears at the `perfect’ climatological elevation (650hPa) but is slightly more to the north with respect to climatology and analyses • Intensity (11m/s) compares well with observed climatology (e.g Burpee 1972 and operational analyses for the period) • Realistic clear separation between AEJ and low-level Harmatthan flow at 20E • Weaker than climatology low-level westerly monsoonal flow • Reduced vertical easterly shear due to reduction of the TEJ at 150 hPa with respect to Jul-Aug • Strong horizontal cyclonic shear on the southern flank of the AEJ, leads to condition much more favorable to tropical development
The AEJ in October • October shows a realistic receding of the African monsoon • A realistic weakening of the AEJ, but also of the easterly vertical shear is evident • Tropical Easterly Jet at 200-150 hPa follows climatology, reducing vertical shear and allowing several AEWs to become vortices in spite of reduced horizontal shear in the southern flank of the AEJ
Comparison with NCEP op. Analyses for Sep 2005 Nature Run NCEP operational analyses
AEJ (cont.) The AEJ has a realistic maximum of 11 m/s at 600 hPa but wind speed are too low at 750 and 700 hPa consistently with the altitude bias. Meridional shear of zonal wind is realistic and supportive of barotropic instability.
AEJ (cont.) The AEJ has a perfectly realistic maximum of 11 m/s at 600 hPa in September and gradually weakens in October following climatology.
African Easterly Waves (AEWs) AEWs show a realistic propagation speed of about 5-9 deg/day, comparable to analyses. Moreover, there is a period of about six weeks in which the majority of waves present signs of development. This is similar to what happens in very active seasons. The disappearance from the Hovm relates to changes in latitude.
Tropical Easterly Jet (TEJ) at 150hPa • The TEJ controls the easterly vertical shear that may inhibit early stages of development. • It is a planetary scale feature connected with the Asian Monsoon • Fluctuations on interannual scale are known (Chen and van Loon, 1987) but intraseasonal variations, despite their importance, are still little known • Eastward retreat of strong easterly speed (40 m/s or higher) throughout the monsoon season, produces decreased vertical easterly shear over the Atlantic and an increasingly favorable environment for development • The NR shows a stronger than climatology TEJ, but a very credible and realistic decrease of easterly speed with the progress of the monsoon season. As a consequence, the environment becomes conducive to more development
Example of nondev. AEW due to Easterly Shear 850hpa Vort (sh) 650 hPa flow In the early stages, 850 hPa vort. increases and vort max becomes aligned with 650hPa circulation center. Eventually upper-level easterly shear suppresses development.
Example of nondev. AEW due to Easterly Shear (cont.) The potentially favorable situation induced by a vertically aligned structure between 800 and 500 hPa at 12-14N is counteracted by easterly vertical shear of the order of 20 m/s.
Nature Run Atlantic tropical cyclone season • First Nature Run to simulate one entire season • Twelve tropical cyclones develop • Realistic variability of tracks • Most intense reaches 957 hPa • Binary vortices, looping and singularities are observed (good from OSSE perspective)
Tropical Cyclones in the Nature Run Five`Early recurvers’ appear in the season. Three central-Atlantic TCs with convincing Extra-tropical transitions, and 3 systems of the Gulf. Overall, very realistic track variability. Early recurvers are more than climatology but not unseen.
Early recurvers do occur in packs Four early recurving systems in an active season, 2004 (NHC).
Tropical cyclone vortices: vertical structure Vertical structure of a TC 2 vortex shows, even at the degraded resolution of 1 deg, a distinct eye-like feature and a very prominent warm core.
`Major’ TC over the Gulf: vertical structure Wind speed (m/s) Temp (oC) Vort (s-1) Vertical structure of TC11 shows another example of eye-like feature and a very prominent warm core. Structure even more impressive than the TC2. Low-level wind speed exceeds 55 m/s; vorticity maxIn the lower levels.
Realistic Variability of TCL system tracks in the Atlantic Looping and Binary vortex interaction 4 systems: Looping, Binary vortex Interaction, Extratropical Transitions and Extra-tropical Re-intensification Singuarities, binary vortex Interactions, Intensity fluctuations Due to large-scale forcing fluctuations
Multiple simultaneous tropical cyclones in the Atlantic 500 hPa geop (m) and 900 hPa rel vort (s-1)
Remarkable days in which almost all possible processes related to Tropical Cyclones happen together:21-24 September Although weaker systems than at other times, the period 21-24Sep is extremely interesting. Multiple tropical cyclogenesis, cyclolysis, subtropical cyclogenesis extratropical transition, looping, binary vortex interaction, center jump, rejuvenation, extratropical reintensification. Up to four tropical or at least partially tropical systems simultaneously present. Tropical-Extratropical interaction is very evident Given the resolution limitations, this is an extraordinary realistic representation of a very active period 500 hPa geop (m) and 900 hPa rel vort (s-1)
Concluding remarks on the African Monson region and tropical Atlantic • A synoptic assessment of the NR over the AM region and the tropical Atlantic shows an overall very realistic African Monsoon, AEJ and wave activity • Several weak tropical and sub-tropical systems are present, together with `major’ tropical cyclones • In spite of a tendency of creating several early recurvers, it can be stated that the NR, given the resolution limitation, does have a very good representativeness of tropical cyclone track variability in the Atlantic, as it would occur in an active season • This Nature Run represents a very promising tool to perform OSSEs over the tropical Atlantic
CURRENT and FUTURE WORK at NASA GSFC (GLA, GMAO, JCSDA and SIVO) on the NR validation • Comprehensive statistics on midlatitude cyclone activity have been performed • Analysis of tropical weather over Indian Ocean and Asian Monsoon regions with emphasis on the Somali Jet, monsoon onset and breaks, tropical depressions, together with an assessment of the Eastern Pacific tropical cyclone, Southern Hemisphere and WPacific seasons is being completed • Results from this comprehensive assessment to be submitted as a journal article during 2008