Download
1 / 38
380 likes | 517 Views
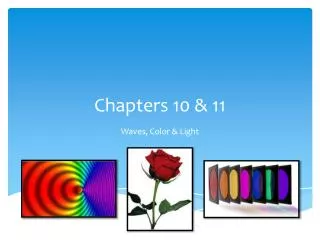
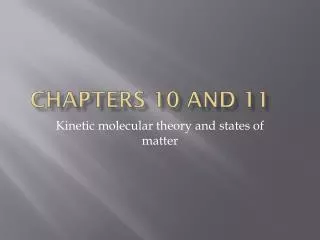
• Chapter 10, 11( except 11.4 and and 11.6 -7) • 3 Phases of Matter : Solid, Liquid and Gas of a single component system( just one type of molecule, no solutions) Phase Transitions: • Intermolecular potentials. London Dispersion/van der Waals interactions

E N D
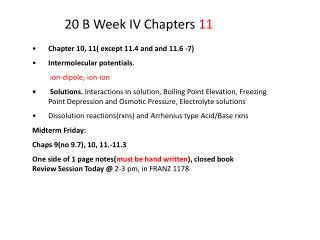
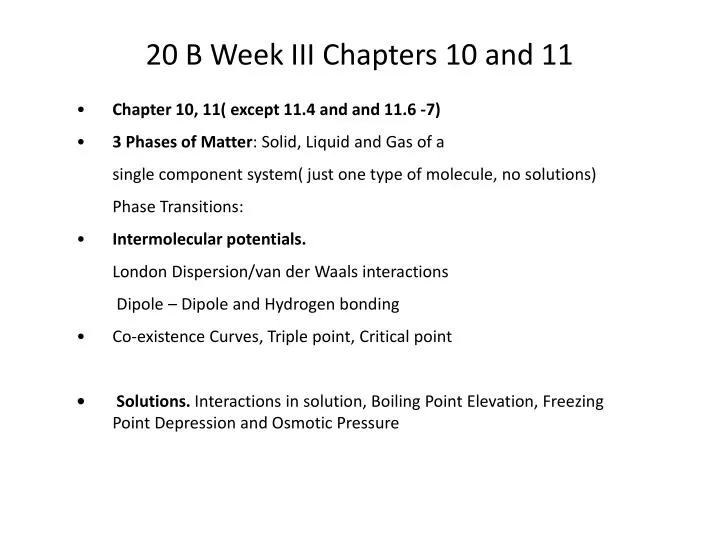
• Chapter 10, 11( except 11.4 and and 11.6 -7) • 3 Phases of Matter: Solid, Liquid and Gas of a single component system( just one type of molecule, no solutions) Phase Transitions: • Intermolecular potentials. London Dispersion/van der Waals interactions Dipole – Dipole and Hydrogen bonding • Co-existence Curves, Triple point, Critical point • Solutions. Interactions in solution, Boiling Point Elevation, Freezing Point Depression and Osmotic Pressure 20 B Week III Chapters 10 and 11
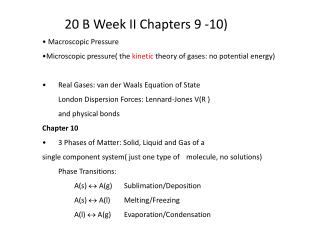
H2O P-T Phase Diagram PE PE+KE KE
Solid/liquid co-existence curve for H2O has a negative slope, all others are positive Boiling point, Melting point and all other Macroscopic properties, Depend on the structure of the Monomer and the Dimer intermolecular Potential Energy, vdW, dipole-dipole, H-bonding, etc Fig. 10-23, p. 464
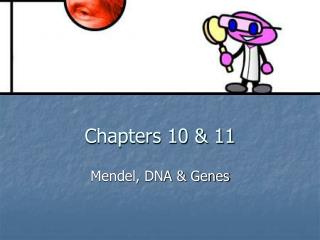
Sublimation of CO2 CO2(s)CO2(g) p. 464
Solid CO2 notice how the molecular structure of the Monomerand intermolecular potential of the Dimer (CO2)2 controls the structure of the solid CO2(s). CO2 is non-polar
Bond dipoles in polyatomic molecule weaker than dipole-dipole for roughly the same Ze
Solid/liquid co-existence curve for H2O has a negative slope, all others are positive Boiling point, Melting point and all other Macroscopic properties, Depend on the structure of the Monomer and the Dimer intermolecular Potential Energy, vdW, dipole-dipole, H-bonding, etc Fig. 10-23, p. 464
All Molecules are SP3 tetrahedral structure(VSEPR), 2 bond pairs and 2 lone pairs, of the H2O monomer leads to hydrogen-bonding of the dimer and a low density of the solid Dipole-Dipole Hydrogen Bonding -e +e -2e O H H +e +e Dipole moment =eRe Electrostatic potential surface: shows the charge distribution
Hydrogen Bonding in the H2O dimer +e -2e +e This Dimer structure (geometry) gives the largest bond energy (e), minimizes repulsion and maximizes attraction. This Dimer geometry leads to the Low density structure of solid H2O(s) ice Fig. 10-13, p. 456
A Snow Flake reflects The monomer molecular structure Molecular structure of the Ice ice reflects (H2O)2 Dimer Fig. 10-14, p. 458
Boiling points vs the period (Ze) Or Ze Fig. 10-12, p. 456
<V(R )> = 0 For R Very Large Density N/V is low Therefore P=(N/V)kT is low 2e 2e +2 2+ R 1 Å = 0.1 nm Å is an Angstrom Fig. 9-18, p. 392
H2O P-T Phase Diagram C=Critical point PE PE+KE KE T=triple point Only 3 phase Can be in equilibrium At one point, e.g., 2 solid phases and a gas Or liquid phase
At the critical point the meniscus disappears .i.e., the gas and liquid becomes a one phase a fluid http://youtu.be/79H2_QVBMGA Fig. 10-22, p. 463
Bond dipoles (kT/ ratio predicts deviations from Idea gas behavior. Since <PE> ~ 0 for real gases If kT>> which forces are dominant? Repulsive forces dominate and P>NkT/V for real gases If kT<< which forces are dominant Attractive forces dominate and P<NkT/V for real gases
Boiling points Or Ze Fig. 10-12, p. 456
<V(R )> = 0 For R Very Large Density N/V is low Therefore P=(N/V)kT is low 2e 2e +2 2+ R 1 Å = 0.1 nm Å is an Angstrom Fig. 9-18, p. 392
London dispersion forces or vdW interaction the Weakest of the intermolecular forces
-e Dipole-Dipole interaction +e Strongest of the physical bonds Except for hydrogen bonds Which are the strongest of the Physical bonds, e.g., (H2O)2 dimer Dipole moment =eRe
Bond dipoles in polyatomic molecule weaker than dipole-dipole for roughly the same Ze
Boiling Points as function of the number of electrons Or Ze Fig. 10-12, p. 456
P NP NP NP P NP NP P NP P P H-bonds VDW Bond dipole VDW dipole-dipole Bond dipole VDW dipole-dipole VDW dipole-dipole H-bonds P=[nRT/(V– nb)] – [a(n/V)2] n=N/NA and R=Nak Notice the difference between polar molecules (dipole moment ≠0) and non-polar molecules (no net dipole moment =0) CO2 and CH4
Real Gas behavior is more consistent with the van der Waals Equation of State than PV=nRT P=[nRT/(V– nb)] – [a(n/V)2] n=N/NA and R=Nak n= number of moles b~ NAexcluded volume per mole (V-nb) repulsive effect a represents the attraction between atoms/molecules. These Equations of State can be determined from theory or by experimentally by fitting P, V, T data! They are generally more accurate than PV=nRT=NkT but they are not universal(each atom/molecule has its own Eq.)
Hard Sphere diameter Gas Liquid Solid Temperature
H2O P-T Phase Diagram PE PE+KE KE
Pressure versus Volume Phase Diagram SO2(g)SO2( l) SO2(s) Shows the deviation from Ideal Gas behavior The Real gas behavior is described well by the vdW Equation Fig. 10-18, p. 461
P NP NP NP P NP NP P NP P P H-bonds VDW Bond dipole VDW dipole-dipole Bond dipole VDW dipole-dipole VDW dipole-dipole H-bonds P=[nRT/(V– nb)] – [a(n/V)2] n=N/NA and R=Nak Notice the difference between polar molecules (dipole moment ≠0) and non-polar molecules (no net dipole moment =0) CO2 and CH4
-e +e Electro-negativity of atoms Dipole moment =eRe A measure of the charge separation In a molecule the more Electronegative atom in a bond will transfer electron density from the less Electronegative atom This forms dipole along the bond
-e Dipole-Dipole interaction +e Strongest of the physical bonds Except for hydrogen bonds Which are the strongest of the Physical bonds, e.g., (H2O)2 dimer Dipole moment =eRe
Chemical bonds versus Physical bonds R (Inter nuclear distance) Between the centers of mass
Chemical bonds versus Physical bonds R (Inter nuclear distance) Between the centers of mass
Minimum Potential Structure of the Dimer: bond angles and bond lengths How did we find this structure in 20A Which equation did we solve and approximation allowed us to find this structure for chemical bonds Recall that these are physical bonds and not chemical (electronic) bonds R (Internuclear distance) Between the centers of mass R-relative center of mass (cm) positions of the HCl monomers in (HCl) Dimer cm= average mass positions along bond in the HCl monomers.
-e +e Dipole moment =eRe A measure of the charge separation and therefore
Chemical bonds versus Physical bonds Physical bonds Uses Van der Waals Eq Chemical bonds Does not use Van der Waals Eq Why?
P NP NP NP P NP NP P NP P P H-bonds VDW Bond dipole VDW dipole-dipole Bond dipole VDW dipole-dipole VDW dipole-dipole H-bonds P=[nRT/(V– nb)] – [a(n/V)2] n=N/NA and R=Nak Notice the difference between polar molecules (dipole moment ≠0) and non-polar molecules (no net dipole moment =0) CO2 and CH4
Boiling points Or Ze Fig. 10-12, p. 456