Download
1 / 2
20 likes | 140 Views
Get the latest News and Updates of Indian Market.

E N D
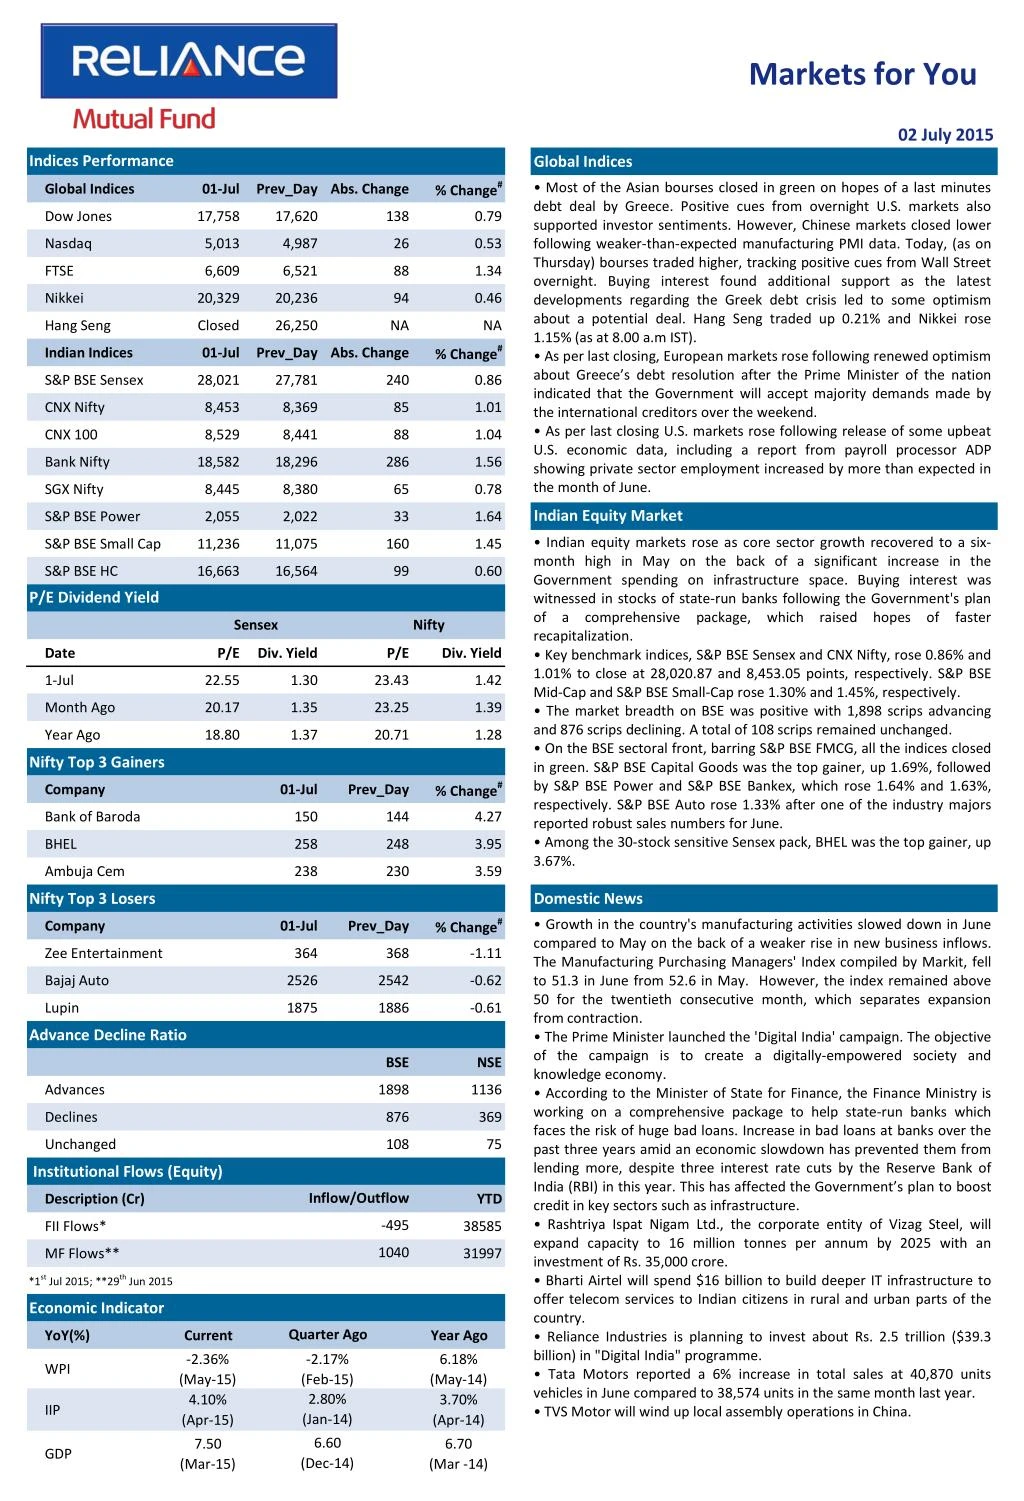
Markets for You 02 July 2015 Indices Performance Global Indices % Change# • Most of the Asian bourses closed in green on hopes of a last minutes debt deal by Greece. Positive cues from overnight U.S. markets also supported investor sentiments. However, Chinese markets closed lower following weaker-than-expected manufacturing PMI data. Today, (as on Thursday) bourses traded higher, tracking positive cues from Wall Street overnight. Buying interest found additional support as the latest developments regarding the Greek debt crisis led to some optimism about a potential deal. Hang Seng traded up 0.21% and Nikkei rose 1.15% (as at 8.00 a.m IST). • As per last closing, European markets rose following renewed optimism about Greece’s debt resolution after the Prime Minister of the nation indicated that the Government will accept majority demands made by the international creditors over the weekend. • As per last closing U.S. markets rose following release of some upbeat U.S. economic data, including a report from payroll processor ADP showing private sector employment increased by more than expected in the month of June. Global Indices 01-Jul Prev_Day Abs. Change Dow Jones 17,758 17,620 138 0.79 Nasdaq 5,013 4,987 26 0.53 FTSE 6,609 6,521 88 1.34 Nikkei 20,329 20,236 94 0.46 Hang Seng Closed 26,250 NA NA % Change# Indian Indices 01-Jul Prev_Day Abs. Change S&P BSE Sensex 28,021 27,781 240 0.86 CNX Nifty 8,453 8,369 85 1.01 CNX 100 8,529 8,441 88 1.04 Bank Nifty 18,582 18,296 286 1.56 SGX Nifty 8,445 8,380 65 0.78 Indian Equity Market S&P BSE Power 2,055 2,022 33 1.64 • Indian equity markets rose as core sector growth recovered to a six- month high in May on the back of a significant increase in the Government spending on infrastructure space. Buying interest was witnessed in stocks of state-run banks following the Government's plan of a comprehensive package, which raised hopes of faster recapitalization. • Key benchmark indices, S&P BSE Sensex and CNX Nifty, rose 0.86% and 1.01% to close at 28,020.87 and 8,453.05 points, respectively. S&P BSE Mid-Cap and S&P BSE Small-Cap rose 1.30% and 1.45%, respectively. • The market breadth on BSE was positive with 1,898 scrips advancing and 876 scrips declining. A total of 108 scrips remained unchanged. • On the BSE sectoral front, barring S&P BSE FMCG, all the indices closed in green. S&P BSE Capital Goods was the top gainer, up 1.69%, followed by S&P BSE Power and S&P BSE Bankex, which rose 1.64% and 1.63%, respectively. S&P BSE Auto rose 1.33% after one of the industry majors reported robust sales numbers for June. • Among the 30-stock sensitive Sensex pack, BHEL was the top gainer, up 3.67%. S&P BSE Small Cap 11,236 11,075 160 1.45 S&P BSE HC 16,663 16,564 99 0.60 P/E Dividend Yield Sensex Nifty Date P/E Div. Yield P/E Div. Yield 1-Jul 22.55 1.30 23.43 1.42 Month Ago 20.17 1.35 23.25 1.39 Year Ago 18.80 1.37 20.71 1.28 Nifty Top 3 Gainers % Change# Company 01-Jul Prev_Day Bank of Baroda 150 144 4.27 BHEL 258 248 3.95 Ambuja Cem 238 230 3.59 Nifty Top 3 Losers Domestic News % Change# • Growth in the country's manufacturing activities slowed down in June compared to May on the back of a weaker rise in new business inflows. The Manufacturing Purchasing Managers' Index compiled by Markit, fell to 51.3 in June from 52.6 in May. However, the index remained above 50 for the twentieth consecutive month, which separates expansion from contraction. • The Prime Minister launched the 'Digital India' campaign. The objective of the campaign is to create a digitally-empowered society and knowledge economy. • According to the Minister of State for Finance, the Finance Ministry is working on a comprehensive package to help state-run banks which faces the risk of huge bad loans. Increase in bad loans at banks over the past three years amid an economic slowdown has prevented them from lending more, despite three interest rate cuts by the Reserve Bank of India (RBI) in this year. This has affected the Government’s plan to boost credit in key sectors such as infrastructure. • Rashtriya Ispat Nigam Ltd., the corporate entity of Vizag Steel, will expand capacity to 16 million tonnes per annum by 2025 with an investment of Rs. 35,000 crore. • Bharti Airtel will spend $16 billion to build deeper IT infrastructure to offer telecom services to Indian citizens in rural and urban parts of the country. • Reliance Industries is planning to invest about Rs. 2.5 trillion ($39.3 billion) in "Digital India" programme. • Tata Motors reported a 6% increase in total sales at 40,870 units vehicles in June compared to 38,574 units in the same month last year. • TVS Motor will wind up local assembly operations in China. Company 01-Jul Prev_Day Zee Entertainment 364 368 -1.11 Bajaj Auto 2526 2542 -0.62 Lupin 1875 1886 -0.61 Advance Decline Ratio BSE NSE Advances 1898 1136 Declines 876 369 Unchanged 108 75 Institutional Flows (Equity) Inflow/Outflow Description (Cr) YTD -495 FII Flows* 38585 1040 MF Flows** 31997 *1st Jul 2015; **29th Jun 2015 Economic Indicator Quarter Ago YoY(%) Current Year Ago -2.36% (May-15) 4.10% (Apr-15) -2.17% (Feb-15) 2.80% (Jan-14) 6.18% (May-14) 3.70% (Apr-14) WPI IIP 6.60 (Dec-14) 7.50 6.70 GDP (Mar-15) (Mar -14)
Markets for You 02 July 2015 Derivatives Market FII Derivative Trade Statistics 01-Jul • Nifty July 2015 Futures were at 8,455.20 points, a premium of 2.15 points against the spot closing of 8,453.05 points. The turnover on NSE’s Futures and Options segment rose from Rs. 1,49,362.43 crore on June 30 to Rs. 1,75,052.43 crore on July 1. • The Put-Call ratio stood at 1.02, compared to the previous session’s close of 0.91. • The Nifty Put-Call ratio stood at 1.10, compared to the previous session at 1.07. • The open interest on Nifty Futures stood at 18.01 million compared to the previous close of 17.24 million. (Rs Cr) Buy Sell Open Int. Index Futures 1618.13 1265.45 13862.29 Index Options 11575.63 11329.23 59296.98 Stock Futures 2275.74 2096.13 44062.00 Stock Options 844.26 815.32 1380.40 Total 16313.76 15506.13 118601.67 Derivative Statistics- Nifty Options 01-Jul Prev_Day Change Indian Debt Market Put Call Ratio (OI) 1.07 1.10 -0.03 • Bond yields fell as investors bought debt on hopes that Greece may reach an agreement with its international creditors. Bargain buying following recent fall in bond prices also boosted market sentiments. • The yield on the new 10-year benchmark bond, 7.72% GS 2025, fell by 4 bps to close at 7.82% compared to the previous close of 7.86%. The paper moved in the range of 7.81% to 7.85% during the trading session. •Banks’ borrowings under the repo window of the Liquidity Adjustment Facility stood at Rs. 3,165 crore (gross) against Rs. 8,061 crore borrowed on June 30. Sale of securities by the RBI under the reverse repo window stood at Rs. 19,133 crore on June 30. • Banks borrowed Rs. 3,900 crore under the RBI’s Marginal Standing facility on June 30 compared to that of June 29 when it borrowed Rs. 60 crore. Put Call Ratio(Vol) 0.95 1.09 -0.14 Debt Watch 01-Jul Wk. Ago Mth. Ago Year Ago Call Rate 7.07% 7.05% 7.41% 8.12% CBLO 6.98% 7.14% 7.59% 8.31% Repo 7.25% 7.25% 7.50% 8.00% Reverse Repo 6.25% 6.25% 6.50% 7.00% 91 Day T-Bill 7.55% 7.63% 7.76% 8.41% 364 Day T-Bill 7.68% 7.72% 7.75% 8.63% 10 Year Gilt 7.82% 7.80% 7.64% 8.74% Currency Market Update • The rupee rose marginally against the greenback on the back of dollar selling by banks and exporters. Gains in domestic equity markets also boosted the rupee. The domestic currency inched up 0.05% to close at 63.61 compared to the previous close of 63.64. • The euro weakened against the dollar after non-farm private employment in the U.S. for June came better than market expectations. Concerns over Greece’s debt situation also weighed on investor sentiments. The euro was trading lower at $1.1069 compared to the previous close of $1.1135. G-Sec Vol. (Rs.Cr) 29569 40328 29074 23692 1 Month CP Rate 7.89% 7.98% 8.09% 8.55% 3 Month CP Rate 8.08% 8.08% 8.25% 8.81% 5 Year Corp Bond 8.60% 8.50% 8.39% 9.21% 1 Month CD Rate 7.64% 7.74% 7.87% 8.44% 3 Month CD Rate 7.74% 7.75% 7.89% 8.51% 1 Year CD Rate 8.08% 8.12% 8.22% 8.89% Currency Market Commodity Market Update • Gold prices remained flat as the dollar rose against the euro and as investors tracked the developments in the Greek debt crisis. • Brent crude prices rose as investors continued to track the developments in Iran’s nuclear program. Currency 01-Jul Prev_Day Change USD/INR 63.62 63.75 -0.13 GBP/INR 99.89 100.12 -0.23 International News EURO/INR 70.77 71.20 -0.43 • A report released by payroll processor ADP showed that employment in the U.S. private sector jumped by 237,000 jobs in June following an upwardly revised increase of 203,000 jobs in May. • Final data from Markit showed that the Euro zone manufacturing sector expanded as the Purchasing Managers' Index rose to 52.5 in June from 52.2 in May. This was the highest reading since April 2014. Growth was observed in all nations except Greece. • China's manufacturing sector contracted at a slightly slower pace in June. The revised manufacturing PMI for June stood at 49.4 from the last month's preliminary reading of 49.6 and 49.2 in May. • The manufacturing sector in Japan continued to expand in June as the latest Manufacturing PMI stood at 50.1 in June compared to 50.9 in May. JPY/INR 0.52 0.52 0.00 Commodity Prices Currency 01-Jul Wk Ago Mth. Ago Year Ago NYMEX Crude($/bl) 56.94 60.01 60.24 106.06 Brent Crude($/bl) 60.20 60.18 62.57 110.89 Gold( $/oz) 1169 1175 1189 1325 Gold(Rs./10 gm) 26263 26448 26772 28149 Source: ICRON Research Disclaimer: “The information herein is meant only for general reading purposes and contains all factual and statistical information pertaining to Industry and markets which have been obtained from independent third-party sources and which are deemed to be reliable. The information provided cannot be considered as guidelines, recommendations or as a professional guide for the readers. It may be noted that since RCAM has not independently verified the accuracy or authenticity of such information or data, or for that matter the reasonableness of the assumptions upon which such data and information has been processed or arrived at; RCAM does not in any manner assures the accuracy or authenticity of such data and information. Some of the statements & assertions contained in these materials may reflect RCAM’s views or opinions, which in turn may have been formed on the basis of such data or information. The Sponsor, the Investment Manager, the Trustee or any of their respective directors, employees, affiliates or representatives do not assume any responsibility for, or warrant the accuracy, completeness, adequacy and reliability of such data or information. Whilst no action has been solicited based upon the information provided herein, due care has been taken to ensure that the facts are accurate and opinions given are fair and reasonable, to the extent possible. This information is not intended to be an offer or solicitation for the purchase or sale of any financial product or instrument. Recipients of this information should rely on information/data arising out of their own investigations. Before making any investments, the readers are advised to seek independent professional advice, verify the contents in order to arrive at an informed investment decision. None of the Sponsor, the Investment Manager, the Trustee, their respective directors, employees, affiliates or representatives shall be liable in any way for any direct, indirect, special, incidental, consequential, punitive or exemplary damages, including on account of lost profits arising from the information contained in this material. Mutual Fund Investments are subject to market risks, read all scheme related documents carefully.