Download
1 / 2

E N D
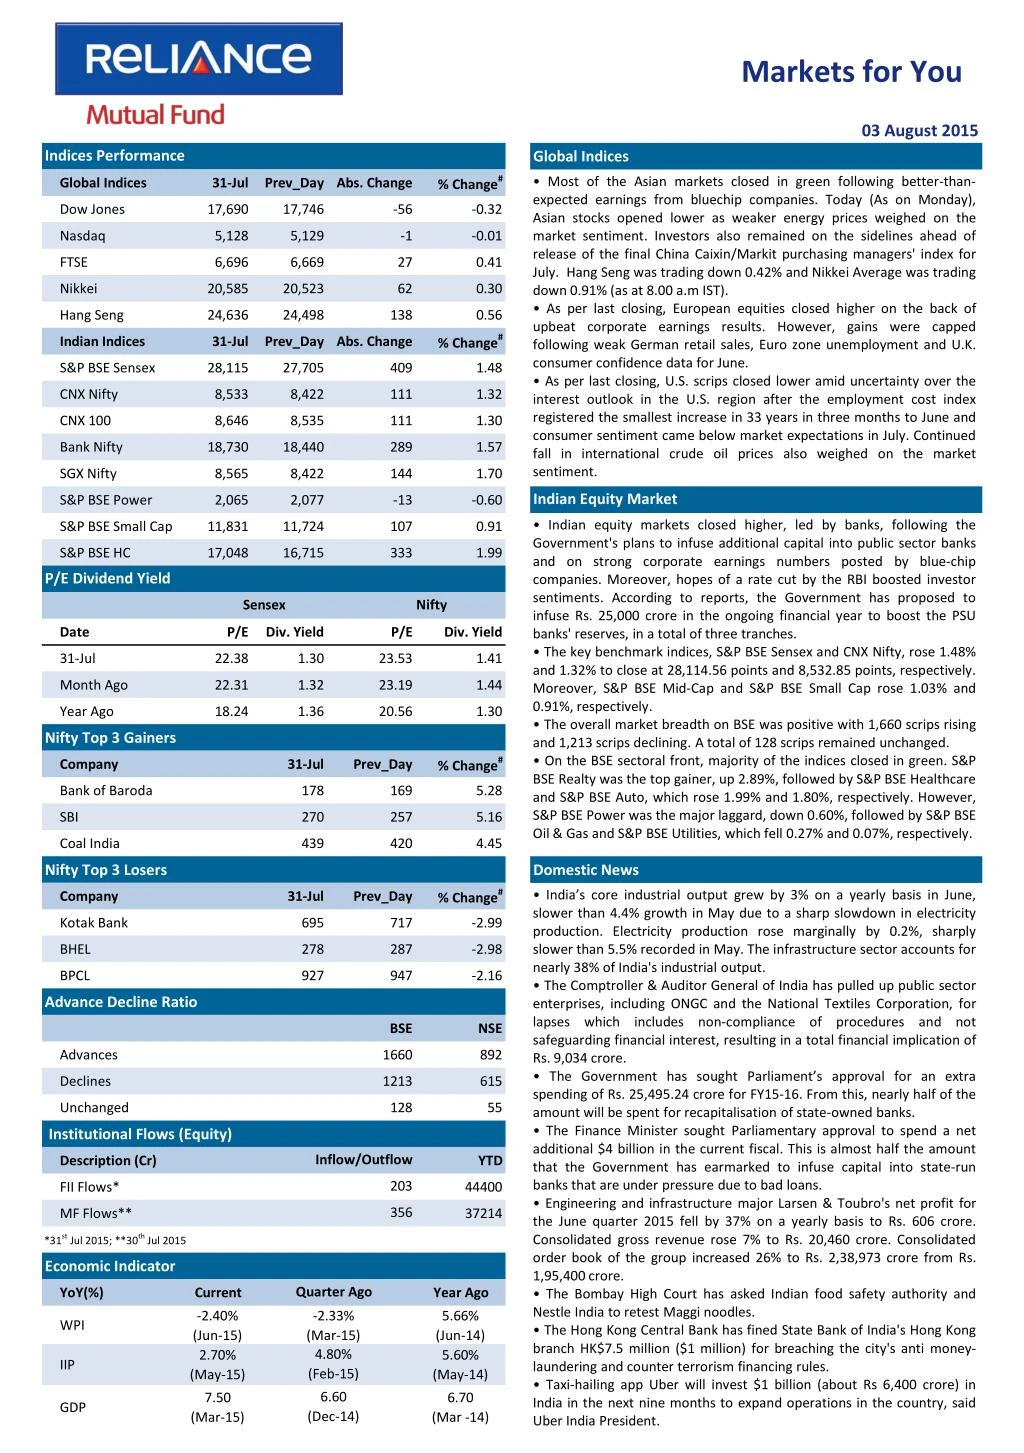
Markets for You 03 August 2015 Indices Performance Global Indices % Change# • Most of the Asian markets closed in green following better-than- expected earnings from bluechip companies. Today (As on Monday), Asian stocks opened lower as weaker energy prices weighed on the market sentiment. Investors also remained on the sidelines ahead of release of the final China Caixin/Markit purchasing managers' index for July. Hang Seng was trading down 0.42% and Nikkei Average was trading down 0.91% (as at 8.00 a.m IST). • As per last closing, European equities closed higher on the back of upbeat corporate earnings results. However, gains were capped following weak German retail sales, Euro zone unemployment and U.K. consumer confidence data for June. • As per last closing, U.S. scrips closed lower amid uncertainty over the interest outlook in the U.S. region after the employment cost index registered the smallest increase in 33 years in three months to June and consumer sentiment came below market expectations in July. Continued fall in international crude oil prices also weighed on the market sentiment. Global Indices 31-Jul Prev_Day Abs. Change Dow Jones 17,690 17,746 -56 -0.32 Nasdaq 5,128 5,129 -1 -0.01 FTSE 6,696 6,669 27 0.41 Nikkei 20,585 20,523 62 0.30 Hang Seng 24,636 24,498 138 0.56 % Change# Indian Indices 31-Jul Prev_Day Abs. Change S&P BSE Sensex 28,115 27,705 409 1.48 CNX Nifty 8,533 8,422 111 1.32 CNX 100 8,646 8,535 111 1.30 Bank Nifty 18,730 18,440 289 1.57 SGX Nifty 8,565 8,422 144 1.70 Indian Equity Market S&P BSE Power 2,065 2,077 -13 -0.60 • Indian equity markets closed higher, led by banks, following the Government's plans to infuse additional capital into public sector banks and on strong corporate earnings numbers posted by blue-chip companies. Moreover, hopes of a rate cut by the RBI boosted investor sentiments. According to reports, the Government has proposed to infuse Rs. 25,000 crore in the ongoing financial year to boost the PSU banks' reserves, in a total of three tranches. • The key benchmark indices, S&P BSE Sensex and CNX Nifty, rose 1.48% and 1.32% to close at 28,114.56 points and 8,532.85 points, respectively. Moreover, S&P BSE Mid-Cap and S&P BSE Small Cap rose 1.03% and 0.91%, respectively. • The overall market breadth on BSE was positive with 1,660 scrips rising and 1,213 scrips declining. A total of 128 scrips remained unchanged. • On the BSE sectoral front, majority of the indices closed in green. S&P BSE Realty was the top gainer, up 2.89%, followed by S&P BSE Healthcare and S&P BSE Auto, which rose 1.99% and 1.80%, respectively. However, S&P BSE Power was the major laggard, down 0.60%, followed by S&P BSE Oil & Gas and S&P BSE Utilities, which fell 0.27% and 0.07%, respectively. S&P BSE Small Cap 11,831 11,724 107 0.91 S&P BSE HC 17,048 16,715 333 1.99 P/E Dividend Yield Sensex Nifty Date P/E Div. Yield P/E Div. Yield 31-Jul 22.38 1.30 23.53 1.41 Month Ago 22.31 1.32 23.19 1.44 Year Ago 18.24 1.36 20.56 1.30 Nifty Top 3 Gainers % Change# Company 31-Jul Prev_Day Bank of Baroda 178 169 5.28 SBI 270 257 5.16 Coal India 439 420 4.45 Nifty Top 3 Losers Domestic News % Change# •India’s core industrial output grew by 3% on a yearly basis in June, slower than 4.4% growth in May due to a sharp slowdown in electricity production. Electricity production rose marginally by 0.2%, sharply slower than 5.5% recorded in May. The infrastructure sector accounts for nearly 38% of India's industrial output. • The Comptroller & Auditor General of India has pulled up public sector enterprises, including ONGC and the National Textiles Corporation, for lapses which includes non-compliance of procedures and not safeguarding financial interest, resulting in a total financial implication of Rs. 9,034 crore. • The Government has sought Parliament’s approval for an extra spending of Rs. 25,495.24 crore for FY15-16. From this, nearly half of the amount will be spent for recapitalisation of state-owned banks. • The Finance Minister sought Parliamentary approval to spend a net additional $4 billion in the current fiscal. This is almost half the amount that the Government has earmarked to infuse capital into state-run banks that are under pressure due to bad loans. • Engineering and infrastructure major Larsen & Toubro's net profit for the June quarter 2015 fell by 37% on a yearly basis to Rs. 606 crore. Consolidated gross revenue rose 7% to Rs. 20,460 crore. Consolidated order book of the group increased 26% to Rs. 2,38,973 crore from Rs. 1,95,400 crore. • The Bombay High Court has asked Indian food safety authority and Nestle India to retest Maggi noodles. • The Hong Kong Central Bank has fined State Bank of India's Hong Kong branch HK$7.5 million ($1 million) for breaching the city's anti money- laundering and counter terrorism financing rules. • Taxi-hailing app Uber will invest $1 billion (about Rs 6,400 crore) in India in the next nine months to expand operations in the country, said Uber India President. Company 31-Jul Prev_Day Kotak Bank 695 717 -2.99 BHEL 278 287 -2.98 BPCL 927 947 -2.16 Advance Decline Ratio BSE NSE Advances 1660 892 Declines 1213 615 Unchanged 128 55 Institutional Flows (Equity) Inflow/Outflow Description (Cr) YTD 203 FII Flows* 44400 356 MF Flows** 37214 *31st Jul 2015; **30th Jul 2015 Economic Indicator Quarter Ago YoY(%) Current Year Ago -2.40% (Jun-15) 2.70% (May-15) -2.33% (Mar-15) 4.80% (Feb-15) 5.66% (Jun-14) 5.60% (May-14) WPI IIP 6.60 (Dec-14) 7.50 6.70 GDP (Mar-15) (Mar -14)
Markets for You 03 August 2015 Derivatives Market FII Derivative Trade Statistics 31-Jul • Nifty August 2015 Futures were at 8,569.65 points, a premium of 36.80 points against the spot closing of 8,532.85 points. The turnover on NSE’s Futures and Options segment fell from Rs. 5,41,777.19 crore on July 30 to Rs. 1,66,271.51 crore on July 31. • The Put-Call ratio stood at 0.77, compared to the previous session’s close of 0.98. • The Nifty Put-Call stood at 0.91, compared to the previous session’s close of 1.00. • The open interest on Nifty Futures stood at 17.88 million compared to the previous session’s close of 26.00 million. (Rs Cr) Buy Sell Open Int. Index Futures 3765.15 3978.10 13771.71 Index Options 16861.55 17742.95 57251.90 Stock Futures 12120.94 12186.20 46980.63 Stock Options 790.46 779.55 131.32 Total 33538.10 34686.80 118135.56 Derivative Statistics- Nifty Options 31-Jul Prev_Day Change Indian Debt Market • Bond yields fell on expectations that decline in international crude oil prices and improving monsoon rains will push the Central Bank to provide guidance on further monetary easing on August 4. • The yield on the 10-year benchmark bond, 7.72% GS 2025, eased 1 bps to 7.81% compared to the previous close of 7.82%. The paper moved in the range of 7.80% to 7.85% during the trading session. •Banks’ borrowings under the repo window of the Liquidity Adjustment Facility stood at Rs. 2,224 crore (gross) against Rs. 2,460 crore borrowed on July 30. Sale of securities by the RBI under the reverse repo window stood at Rs. 5,820 crore on July 30. • Banks did not borrow under the RBI’s Marginal Standing facility on July 30 compared to that of July 29, when it borrowed Rs. 25 crore. • The RBI conducted 14-days variable rate repo auction for the notified amount of Rs. 15,500 crore. An amount of Rs. 2,525 crore was allotted at a cut-off rate of 7.27%. Put Call Ratio (OI) 0.91 1.00 -0.09 Put Call Ratio(Vol) 0.82 1.01 -0.19 Debt Watch 31-Jul Wk. Ago Mth. Ago Year Ago Call Rate 7.09% 7.12% 7.06% 8.05% CBLO 7.05% 6.80% 7.20% 8.04% Repo 7.25% 7.25% 7.25% 8.00% Reverse Repo 6.25% 6.25% 6.25% 7.00% 91 Day T-Bill 7.30% 7.24% 7.60% 8.56% 364 Day T-Bill 7.57% 7.57% 7.72% 8.64% 10 Year Gilt 7.81% 7.83% 7.86% 8.50% Currency Market Update G-Sec Vol. (Rs.Cr) 32118 33880 29569 21011 • The Indian rupee declined against the dollar following month-end demand of the greenback from importers. The domestic currency fell for the second consecutive day to close at 64.13 per dollar compared to the previous close of 64.04. • After falling for three consecutive days, the euro rose against the dollar after the U.S. employment cost index rose at the slowest pace since 1982 in the June quarter. The euro was trading at $1.1056 compared to the previous close of $1.0931. 1 Month CP Rate 7.53% 7.59% 7.99% 8.65% 3 Month CP Rate 7.91% 8.00% 8.15% 8.95% 5 Year Corp Bond 8.45% 8.50% 8.64% 9.32% 1 Month CD Rate 7.34% 7.39% 7.81% 8.41% 3 Month CD Rate 7.55% 7.60% 7.76% 8.84% 1 Year CD Rate 7.94% 8.02% 8.11% 9.05% Currency Market Commodity Market Update • Gold prices rose following weakness in the dollar . • Brent crude prices remained under pressure as OPEC Secretary General said that the organization was not ready to reduce production and will keep the same unchanged at 30 million barrels a day. Currency 31-Jul Prev_Day Change USD/INR 64.01 64.01 0.00 GBP/INR 99.84 99.83 0.01 International News EURO/INR 70.16 70.07 0.09 • The U.S. Labour Department in its report showed that U.S. employment costs rose 0.2% in three months to June. U.S. employment costs rose 0.7% in the three months to March. This was the lowest gain since 1982. • As per the preliminary figures, Euro zone inflation remained steady at 0.2% in July compared to June. Inflation remained in the positive territory for the third consecutive month. Core inflation rose to 1% from 0.8%. • Germany's retail sales fell unexpectedly by 2.3% (calendar and seasonally adjusted) (M-o-M) in June compared to 0.4% rise in the previous month. Sales recorded its first fall in three months. •Japan’s unemployment rate stood at 3.4% (seasonally adjusted) in June compared to 3.3% in May. JPY/INR 0.52 0.52 0.00 Commodity Prices Currency 31-Jul Wk Ago Mth. Ago Year Ago NYMEX Crude($/bl) 47.11 47.98 47.37 98.23 Brent Crude($/bl) 53.64 54.39 53.96 104.84 Gold( $/oz) 1095 1098 1095 1282 Gold(Rs./10 gm) 24592 24599 24592 27906 Source: ICRON Research Disclaimer: “The information herein is meant only for general reading purposes and contains all factual and statistical information pertaining to Industry and markets which have been obtained from independent third-party sources and which are deemed to be reliable. The information provided cannot be considered as guidelines, recommendations or as a professional guide for the readers. It may be noted that since RCAM has not independently verified the accuracy or authenticity of such information or data, or for that matter the reasonableness of the assumptions upon which such data and information has been processed or arrived at; RCAM does not in any manner assures the accuracy or authenticity of such data and information. Some of the statements & assertions contained in these materials may reflect RCAM’s views or opinions, which in turn may have been formed on the basis of such data or information. The Sponsor, the Investment Manager, the Trustee or any of their respective directors, employees, affiliates or representatives do not assume any responsibility for, or warrant the accuracy, completeness, adequacy and reliability of such data or information. Whilst no action has been solicited based upon the information provided herein, due care has been taken to ensure that the facts are accurate and opinions given are fair and reasonable, to the extent possible. This information is not intended to be an offer or solicitation for the purchase or sale of any financial product or instrument. Recipients of this information should rely on information/data arising out of their own investigations. Before making any investments, the readers are advised to seek independent professional advice, verify the contents in order to arrive at an informed investment decision. None of the Sponsor, the Investment Manager, the Trustee, their respective directors, employees, affiliates or representatives shall be liable in any way for any direct, indirect, special, incidental, consequential, punitive or exemplary damages, including on account of lost profits arising from the information contained in this material. Mutual Fund Investments are subject to market risks, read all scheme related documents carefully.