Download
1 / 2
20 likes | 249 Views
The different types of mutual funds in India are: closed ended funds, open ended funds, tax saving funds, equity funds, growth funds, balanced funds, value funds and large capital funds.

E N D
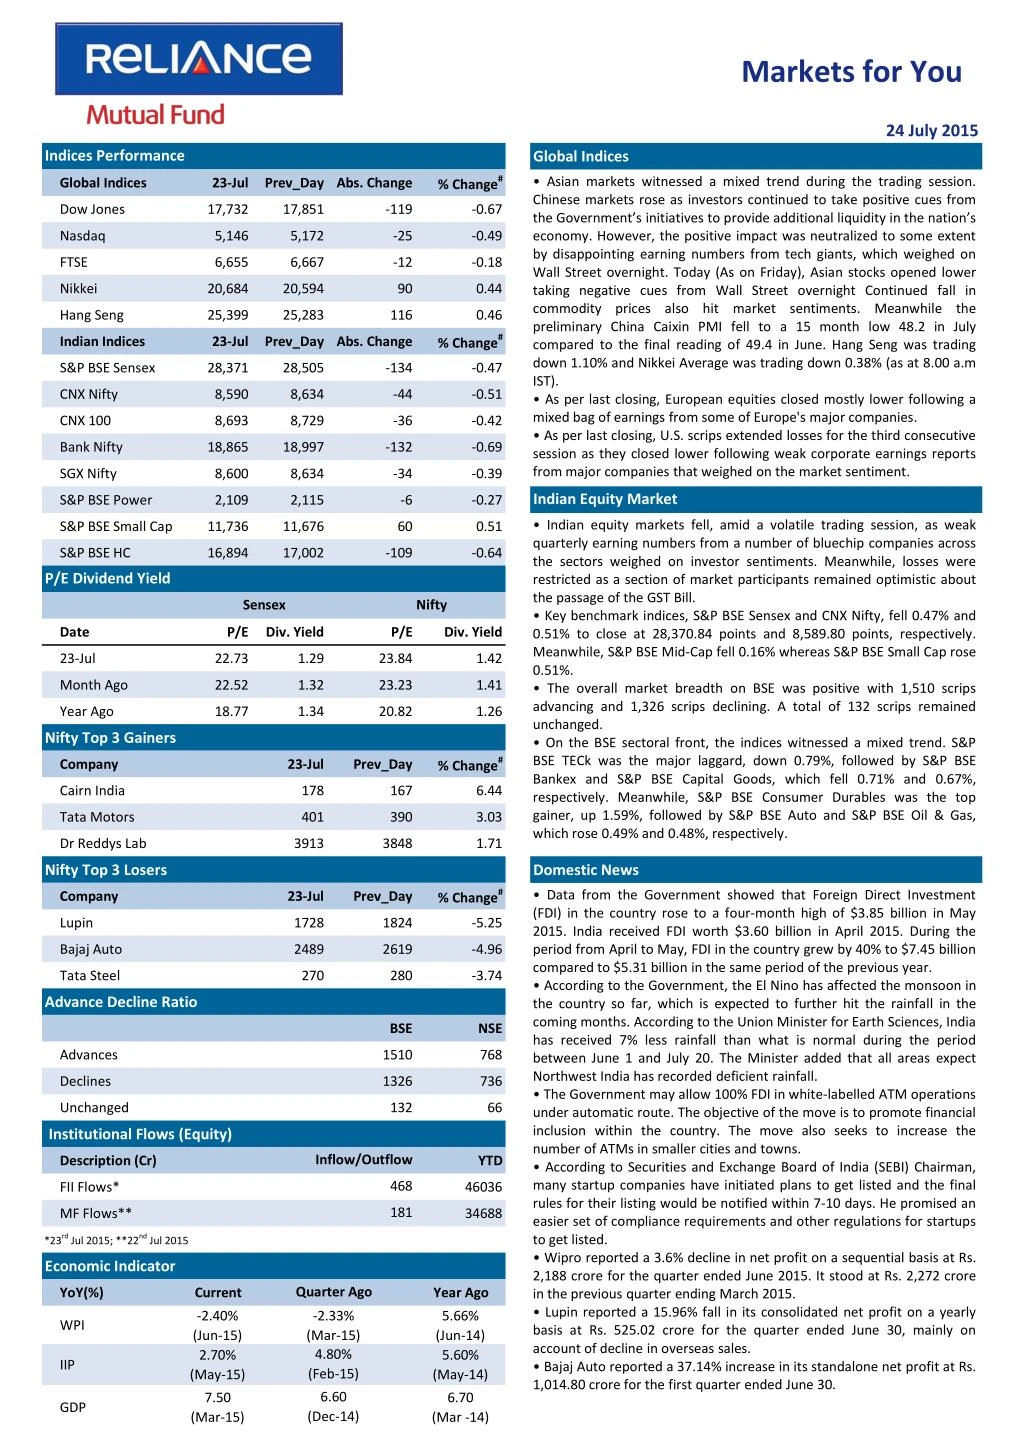
Markets for You 24 July 2015 Indices Performance Global Indices % Change# • Asian markets witnessed a mixed trend during the trading session. Chinese markets rose as investors continued to take positive cues from the Government’s initiatives to provide additional liquidity in the nation’s economy. However, the positive impact was neutralized to some extent by disappointing earning numbers from tech giants, which weighed on Wall Street overnight. Today (As on Friday), Asian stocks opened lower taking negative cues from Wall Street overnight Continued fall in commodity prices also hit market sentiments. Meanwhile the preliminary China Caixin PMI fell to a 15 month low 48.2 in July compared to the final reading of 49.4 in June. Hang Seng was trading down 1.10% and Nikkei Average was trading down 0.38% (as at 8.00 a.m IST). • As per last closing, European equities closed mostly lower following a mixed bag of earnings from some of Europe's major companies. • As per last closing, U.S. scrips extended losses for the third consecutive session as they closed lower following weak corporate earnings reports from major companies that weighed on the market sentiment. Global Indices 23-Jul Prev_Day Abs. Change Dow Jones 17,732 17,851 -119 -0.67 Nasdaq 5,146 5,172 -25 -0.49 FTSE 6,655 6,667 -12 -0.18 Nikkei 20,684 20,594 90 0.44 Hang Seng 25,399 25,283 116 0.46 % Change# Indian Indices 23-Jul Prev_Day Abs. Change S&P BSE Sensex 28,371 28,505 -134 -0.47 CNX Nifty 8,590 8,634 -44 -0.51 CNX 100 8,693 8,729 -36 -0.42 Bank Nifty 18,865 18,997 -132 -0.69 SGX Nifty 8,600 8,634 -34 -0.39 Indian Equity Market S&P BSE Power 2,109 2,115 -6 -0.27 • Indian equity markets fell, amid a volatile trading session, as weak quarterly earning numbers from a number of bluechip companies across the sectors weighed on investor sentiments. Meanwhile, losses were restricted as a section of market participants remained optimistic about the passage of the GST Bill. • Key benchmark indices, S&P BSE Sensex and CNX Nifty, fell 0.47% and 0.51% to close at 28,370.84 points and 8,589.80 points, respectively. Meanwhile, S&P BSE Mid-Cap fell 0.16% whereas S&P BSE Small Cap rose 0.51%. • The overall market breadth on BSE was positive with 1,510 scrips advancing and 1,326 scrips declining. A total of 132 scrips remained unchanged. • On the BSE sectoral front, the indices witnessed a mixed trend. S&P BSE TECk was the major laggard, down 0.79%, followed by S&P BSE Bankex and S&P BSE Capital Goods, which fell 0.71% and 0.67%, respectively. Meanwhile, S&P BSE Consumer Durables was the top gainer, up 1.59%, followed by S&P BSE Auto and S&P BSE Oil & Gas, which rose 0.49% and 0.48%, respectively. S&P BSE Small Cap 11,736 11,676 60 0.51 S&P BSE HC 16,894 17,002 -109 -0.64 P/E Dividend Yield Sensex Nifty Date P/E Div. Yield P/E Div. Yield 23-Jul 22.73 1.29 23.84 1.42 Month Ago 22.52 1.32 23.23 1.41 Year Ago 18.77 1.34 20.82 1.26 Nifty Top 3 Gainers % Change# Company 23-Jul Prev_Day Cairn India 178 167 6.44 Tata Motors 401 390 3.03 Dr Reddys Lab 3913 3848 1.71 Nifty Top 3 Losers Domestic News % Change# • Data from the Government showed that Foreign Direct Investment (FDI) in the country rose to a four-month high of $3.85 billion in May 2015. India received FDI worth $3.60 billion in April 2015. During the period from April to May, FDI in the country grew by 40% to $7.45 billion compared to $5.31 billion in the same period of the previous year. • According to the Government, the El Nino has affected the monsoon in the country so far, which is expected to further hit the rainfall in the coming months. According to the Union Minister for Earth Sciences, India has received 7% less rainfall than what is normal during the period between June 1 and July 20. The Minister added that all areas expect Northwest India has recorded deficient rainfall. • The Government may allow 100% FDI in white-labelled ATM operations under automatic route. The objective of the move is to promote financial inclusion within the country. The move also seeks to increase the number of ATMs in smaller cities and towns. • According to Securities and Exchange Board of India (SEBI) Chairman, many startup companies have initiated plans to get listed and the final rules for their listing would be notified within 7-10 days. He promised an easier set of compliance requirements and other regulations for startups to get listed. • Wipro reported a 3.6% decline in net profit on a sequential basis at Rs. 2,188 crore for the quarter ended June 2015. It stood at Rs. 2,272 crore in the previous quarter ending March 2015. • Lupin reported a 15.96% fall in its consolidated net profit on a yearly basis at Rs. 525.02 crore for the quarter ended June 30, mainly on account of decline in overseas sales. • Bajaj Auto reported a 37.14% increase in its standalone net profit at Rs. 1,014.80 crore for the first quarter ended June 30. Company 23-Jul Prev_Day Lupin 1728 1824 -5.25 Bajaj Auto 2489 2619 -4.96 Tata Steel 270 280 -3.74 Advance Decline Ratio BSE NSE Advances 1510 768 Declines 1326 736 Unchanged 132 66 Institutional Flows (Equity) Inflow/Outflow Description (Cr) YTD 468 FII Flows* 46036 181 MF Flows** 34688 *23rd Jul 2015; **22nd Jul 2015 Economic Indicator Quarter Ago YoY(%) Current Year Ago -2.40% (Jun-15) 2.70% (May-15) -2.33% (Mar-15) 4.80% (Feb-15) 5.66% (Jun-14) 5.60% (May-14) WPI IIP 6.60 (Dec-14) 7.50 6.70 GDP (Mar-15) (Mar -14)
Markets for You 24 July 2015 Derivatives Market FII Derivative Trade Statistics 23-Jul • Nifty July 2015 Futures were at 8,603.70 points, a premium of 13.90 points against the spot closing of 8,589.80 points. The turnover on NSE’s Futures and Options segment fell from Rs. 3,09,331.74 crore on July 22 to Rs. 2,86,556.29 crore on July 23. • The Put-Call ratio stood at 0.96, compared to the previous session’s close of 1.11. • The Nifty Put-Call stood at 1.15, compared to the previous session’s close of 1.22. • The open interest on Nifty Futures stood at 23.70 million compared to the previous close of 24.09 million. (Rs Cr) Buy Sell Open Int. Index Futures 1808.54 2103.50 21336.25 Index Options 15737.40 15021.40 90347.45 Stock Futures 2869.52 3132.84 51199.86 Stock Options 2528.08 2511.07 3497.01 Total 22943.54 22768.81 166380.57 Derivative Statistics- Nifty Options 23-Jul Prev_Day Change Indian Debt Market Put Call Ratio (OI) 1.15 1.22 -0.08 • Bond yields fell as investors bought debt amid fall in international crude oil prices. Investor sentiments improved following progress of monsoons. • The yield on the 10-year benchmark bond, 7.72% GS 2025, eased 3 bps to close at 7.80% compared to the previous close of 7.83%. The paper moved in the range of 7.80% to 7.83% during the trading session. •Banks’ borrowings under the repo window of the LAF stood at Rs. 3,106 crore (gross) against Rs. 7,440 crore borrowed on July 22. Sale of securities by the RBI under the reverse repo window stood at Rs. 1,378 crore on July 22. • Banks did not borrow under the RBI’s Marginal Standing facility on July 22 compared to that of July 21, when it borrowed Rs. 15 crore. • The RBI has set the underwriting cut-off rate for 7.35% GS 2024 at 0.39 paise, 7.88% GS 2030 at 0.44 paise, 7.95% GS 2032 at 0.89 paise and 8.17% GS 2044 at 0.89 paise per Rs. 100. Put Call Ratio(Vol) 1.01 1.18 -0.16 Debt Watch 23-Jul Wk. Ago Mth. Ago Year Ago Call Rate 7.07% 7.07% 7.07% 8.70% CBLO 7.16% 7.17% 7.22% 8.97% Repo 7.25% 7.25% 7.25% 8.00% Reverse Repo 6.25% 6.25% 6.25% 7.00% 91 Day T-Bill 7.35% 7.35% 7.61% 8.50% 364 Day T-Bill 7.58% 7.56% 7.69% 8.66% 10 Year Gilt 7.80% 7.84% 7.75% 8.66% Currency Market Update G-Sec Vol. (Rs.Cr) 36321 16072 50424 42043 • The rupee weakened against the dollar as foreign banks bought the greenback amid possibility that the U.S. Federal Reserve may raise interest rates this year. The rupee fell by 0.29% to close at 63.76 compared to the previous close of 63.58. • The euro rose against the dollar as concerns over Greece’s debt situation eased after the Greek Parliament passed a second set of crucial reforms, paving the way for the country's third bailout. The euro was trading higher at $1.0994 compared to the previous close of $1.0933. 1 Month CP Rate 7.61% 7.74% 8.00% 8.68% 3 Month CP Rate 8.00% 7.99% 8.10% 8.99% 5 Year Corp Bond 8.51% 8.54% 8.51% 9.31% 1 Month CD Rate 7.39% 7.42% 7.73% 8.61% 3 Month CD Rate 7.62% 7.69% 7.78% 8.75% 1 Year CD Rate 8.01% 8.04% 8.13% 9.01% Currency Market Commodity Market Update • Gold prices rose on the back of positive demand outlook after the number of individuals filing for initial jobless benefits in the U.S. last week fell to the lowest level since November 1973. • Brent crude prices fell after U.S. crude oil inventories unexpectedly rose by 2.5 million barrels last week to 463.9 million barrels. Currency 23-Jul Prev_Day Change USD/INR 63.71 63.53 0.19 GBP/INR 99.57 99.19 0.38 International News EURO/INR 69.63 69.60 0.02 • Data from the National Association of Realtors showed that existing home sales in the U.S. climbed 3.2% to an annual rate of 5.49 million in June from a downwardly revised 5.32 million in May. • The Parliament of Greece passed legislation on a second batch of reforms which is needed to help unlock a huge international bailout for the country. The legislation includes changes to the civil justice system, a bank deposit protection scheme and measures that will help shore up liquidity of Greece's banks. • Data from the Ministry of Finance showed that Japan posted a merchandise trade deficit of 69.045 billion yen in June following a downwardly revised 217.2 billion yen deficit in May. JPY/INR 0.51 0.51 0.00 Commodity Prices Currency 23-Jul Wk Ago Mth. Ago Year Ago NYMEX Crude($/bl) 48.11 50.90 61.05 103.81 Brent Crude($/bl) 55.86 57.36 60.22 106.65 Gold( $/oz) 1090 1145 1178 1304 Gold(Rs./10 gm) 25010 25708 26509 27942 Source: ICRON Research Disclaimer: “The information herein is meant only for general reading purposes and contains all factual and statistical information pertaining to Industry and markets which have been obtained from independent third-party sources and which are deemed to be reliable. The information provided cannot be considered as guidelines, recommendations or as a professional guide for the readers. It may be noted that since RCAM has not independently verified the accuracy or authenticity of such information or data, or for that matter the reasonableness of the assumptions upon which such data and information has been processed or arrived at; RCAM does not in any manner assures the accuracy or authenticity of such data and information. Some of the statements & assertions contained in these materials may reflect RCAM’s views or opinions, which in turn may have been formed on the basis of such data or information. The Sponsor, the Investment Manager, the Trustee or any of their respective directors, employees, affiliates or representatives do not assume any responsibility for, or warrant the accuracy, completeness, adequacy and reliability of such data or information. Whilst no action has been solicited based upon the information provided herein, due care has been taken to ensure that the facts are accurate and opinions given are fair and reasonable, to the extent possible. This information is not intended to be an offer or solicitation for the purchase or sale of any financial product or instrument. Recipients of this information should rely on information/data arising out of their own investigations. Before making any investments, the readers are advised to seek independent professional advice, verify the contents in order to arrive at an informed investment decision. None of the Sponsor, the Investment Manager, the Trustee, their respective directors, employees, affiliates or representatives shall be liable in any way for any direct, indirect, special, incidental, consequential, punitive or exemplary damages, including on account of lost profits arising from the information contained in this material. Mutual Fund Investments are subject to market risks, read all scheme related documents carefully.