Download
1 / 29
290 likes | 298 Views
This chapter explores the geographies of population, including factors such as birth, death, and migration. It also discusses the global implications of population dynamics and the challenges of providing basic necessities to a growing population.

E N D
Human Geography 4ePlaces and Regions in Global ContextAuthors: Paul L. Knox & Sallie A. MarstonPowerPoint Author: Keith M. Bell Chapter 3: Geographies of Population
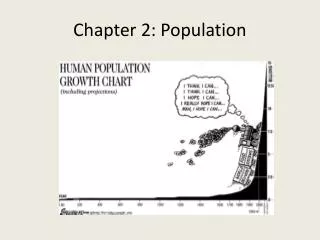
Main Points • Population geographers depend on a wide array of data sources to assess the geography of populations. • Population geographers are largely concerned with the same sorts of questions that other population experts study, but they also investigate “the why of where.” • Two of the most important factors that make up population dynamics are birth and death. • A third crucial force in population change is the movement of populations. • U.N. Millennium Summit in 2000: How can the global economy provide the world’s growing population with enough food and safe drinking water, and a sustainable environment, so that all the world’s people have the basic necessities for enjoying happy, healthy, and satisfying lives?
Censuses and Vital Records At the simple level, a census is a straightforward count of the number of people in a country, region, or city. Vital records report births, deaths, marriages, divorces, and the incidence of certain infectious diseases. Vital records on the web
Population Distribution As this map shows, the world’s population is not uniformly distributed across the globe. (2004)
Population Distribution in Egypt Egypt’s population distribution is closely linked to the proximity of water. In the north, the population clusters along the Mediterranean and in the interior, along the banks of the Nile River. (2004)
Population Density and Composition Crude density, also called arithmetic density, is the total number of people divided by the total land area.
Health-care Density Another measure of population density is reflected in this map, which shows the number of physicians per people in the total population.
Types of Population Pyramids Zero population growth (2000) Slow population growth (2000) Rapid population growth (2000)
GIS Marketing Applications GIS Marketing Applications • Georeferencing: linking demographic data to particular locations • Aids in the successful location of businesses • Pertinent demographic data includes income level, education level, home value, age, and number of household residents Starbucks Coffee Company Catchment >
Baby Boom and Aging U.S. baby boom crude birth rate Elderly people in the United States
Pyramid Properties Demographers will divide the total population into three age cohorts, sometimes further dividing those cohorts by sex. • The youth cohort consists of those members of the population who are less than 15 years of age. • The middle cohort consists of those members of the population aged 15 to 64. • The old-age cohort consists of those members of the population aged 65 and older.
Population Pyramids: Tucson Population pyramids of Tucson census tracts, 2000
World Crude Birth Rates Crude birth rates and crude death rates are often indicators of the levels of economic development in individual countries. Compare, for instance, Australia, a core country, which offers a stark contrast to statistics for Ethiopia, a very poor underdeveloped peripheral country.
World Crude Death Rate The global pattern of crude death rates varies from crude birth rates. (2004)
World Rates of Natural Increase Rates of natural increase are highest in sub-Saharan Africa, the Near East, and parts of Asia, as well as parts of South and Central America. (2004)
World Infant Mortality Rates The geography of poverty underlies the patterns shown in this map and allows us to analyze the linkages between population variables and social conditions. (2004)
Demographic Transition Theory The transition from a stable population based on high birth and death rates to one based on low birth and death rates progresses in clearly defined stages.
World Trends The graph is an illustration of the impact of affluence on reproductive choices.
Global Voluntary Migration The map illustrates very complex flows of people across borders who have migrated by choice. (1999)
Refugee-sending Countries War is certainly the most compelling factor in forcing refugee migration. Shown are the sending countries, those whose internal situations propelled people to leave.
Kurdish and Lebanese Diaspora The most significant diasporic populations of Middle East and North Africa during modern times are the Palestinians, Lebanese, and Kurdish peoples.
Internal Displacement This map provides an indication of the geographical extent and numbers of people displaced from their livelihoods and homes but still living within their own countries.
Changing Demographic Center of the U.S. Knowing where the demographic center of a country’s population is located at given times allows us to track that population’s movement, growth, distribution, and concentration. (1790-2000)
Trail of Tears The Indian Removal Act of 1830
Famine Migrants Today forced eco-migration – population movement caused by the degradation of land and essential natural resources – has created a new category of migrants and refugees.
Population Policies and Programs World population projection by region
World Population This map provides a sense of how much the populations of various countries are expected to change by the year 2020.
Millennium Development Goals Goals and Targets Goal 1: Eradicate extreme poverty and hunger Goal 2: Achieve universal primary education Goal 3: Promote gender equality and empower women Goal 4: Reduce child mortality Goal 5: Improve maternal health Goal 6: Combat HIV/AIDS, malaria, and other diseases Goal 7: Ensure environmental sustainability* Goal 8: Develop a Global Partnership for Development* * The selection of indicators for Goals 7 and 8 is subject to further refinement.