Download
1 / 4
40 likes | 131 Views
Figure 1. Schéma de l’étude RADH 2304. Randomisation. EVR (C0 : 3-8 ng /ml). n = 231. n = 719. EVR (C0 : 6-10 ng/ml) + TAC-élim + corticoïdes. n = 1 147. + TAC réduit. Trans-plantation. n = 245. EVR (C0 : 3-8 ng/ml) + TAC réduit + corticoïdes (EVR+ TAC-r). 30 ± 5 jours.

E N D
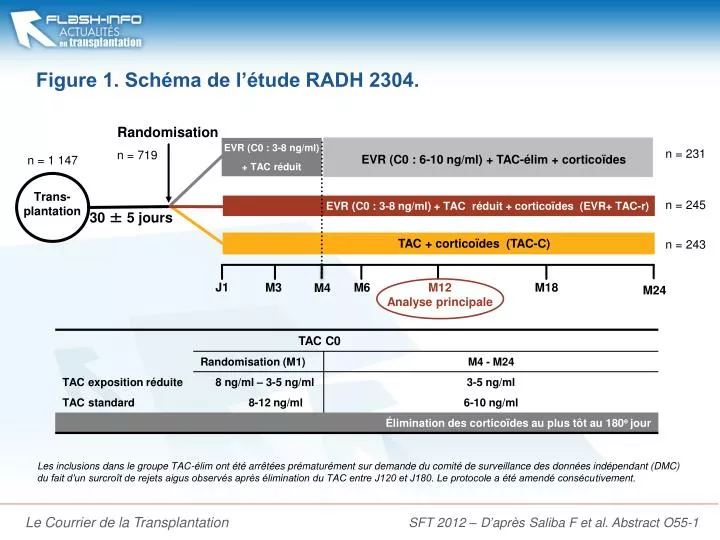
Figure 1. Schéma de l’étude RADH 2304. Randomisation EVR (C0 : 3-8 ng/ml) n = 231 n = 719 EVR (C0 : 6-10 ng/ml) + TAC-élim + corticoïdes n = 1 147 + TAC réduit Trans-plantation n = 245 EVR (C0 : 3-8 ng/ml) + TAC réduit + corticoïdes (EVR+ TAC-r) 30 ± 5 jours TAC + corticoïdes (TAC-C) n = 243 J1 M3 M6 M18 M12 Analyse principale M4 M24 Les inclusions dans le groupe TAC-élim ont été arrêtées prématurément sur demande du comité de surveillance des données indépendant (DMC) du fait d’un surcroît de rejets aigus observés après élimination du TAC entre J120 et J180. Le protocole a été amendé consécutivement. SFT 2012 – D’après Saliba F et al. Abstract O55-1
Tableau 1. Critère principal d’efficacité. Critère composite (rejet aigu prouvé par biopsie et traité, perte du greffon ou décès) SFT 2012 – D’après Saliba F et al. Abstract O55-1
Figure 2. Évolution de la fonction rénale entre la randomisation et M12 (analyse sur la population traitée). EVR + TAC-r TAC-C TAC-élim ∆(EVR-TAC-r – TAC-C) ∆(TAC-élim – TAC-C) SFT 2012 – D’après Saliba F et al. Abstract O55-1
Tableau 2. Données de tolérance. * EVR + TAC-r versus TAC-C SFT 2012 – D’après Saliba F et al. Abstract O55-1