Download
1 / 8
80 likes | 237 Views
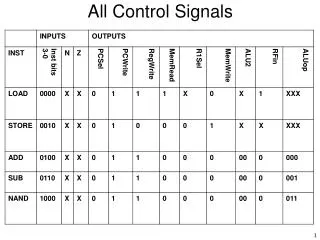
Absolute Calibration of IFO Control Signals. A comparison of two simple DC calibration methods of IFO control signals Luca Matone LIGO Caltech Michael Landry LIGO Hanford Observatory Detector Characterization Session. ITM calibration: fringe counting.

E N D
Absolute Calibration of IFO Control Signals A comparison of two simple DC calibration methods of IFO control signals Luca Matone LIGO Caltech Michael Landry LIGO Hanford Observatory Detector Characterization Session LSC Meeting Mar 22, '02
ITM calibration: fringe counting • Basic idea: drive mass with known force and measure displacement • Drive the ITM with a slow sinusoid (0.1 Hz) and count the number of fringes that are read out at the antisymmetric port. LSC Meeting Mar 22, '02
Swinging data AS DC ITM control signal LSC Meeting Mar 22, '02
Fringe count analysis: 4k ITMY H1:LSC-ITMY 1.413x10⁻⁹ m/count Sigma 0.185x10⁻⁹ LSC Meeting Mar 22, '02
ITM calibration: fringe toggling Alternative to swinging: Stan Whitcomb suggested toggling the sign of the Michelson control signal LSC Meeting Mar 22, '02
Toggling data AS DC Michelson control signal LSC Meeting Mar 22, '02
Fringe toggling analysis Mean of MICH control signal for a given time stretch “UP” “DOWN” Difference of control signal between two successive locked stretches H1:LSC-ITMY 1.32x10⁻⁹ m/count, Sigma: 0.03x10⁻⁹ LSC Meeting Mar 22, '02
Summary • Two precise measurements of ITM control signal that differ by ~10% • Systematics to account for disagreement • 2% due to pendulum transfer function (0.1Hz drive is not DC measurement) • 6% accounted for by stopband filter: non-unity gain at DC introduced between Michelson control signal and ITM control signal • Remaining 2-3% being hunted down by Luca and Matt Evans (phase lag of the mass with respect to the excitation?) • E2E played a key role in analysis – quick modeling of simple Michelson system and creation of simulated data for understanding of systematics – thanks to Hiro Yamamoto for help in this regard 4k ITM, calibrations, systematics accounted for: FRINGE COUNTING [nm/cnt] SIGN TOGGLING [nm/cnt] --------------------------------------------------------------------- ITMX 1.444 +- 0.009 1.406 +- 0.007 ITMY 1.399 +- 0.020 1.360 +- 0.006 LSC Meeting Mar 22, '02