Download
1 / 24
250 likes | 417 Views
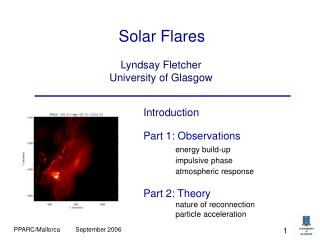
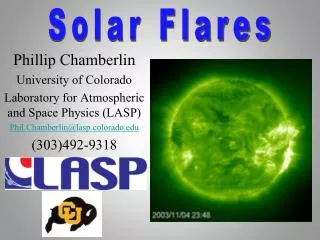
Ryan Payne Advisor: Dana Longcope. Characterization of Heating and Cooling in Solar Flares. Solar Flares. Solar flares are violent releases of matter and energy within active regions on the Sun. Flares are identified by a sudden brightening in chromospheric and coronal emissions.

E N D
Ryan Payne Advisor: Dana Longcope Characterization of Heating and Cooling in Solar Flares
Solar Flares • Solar flares are violent releases of matter and energy within active regions on the Sun. • Flares are identified by a sudden brightening in chromospheric and coronal emissions. • A powerful flare can release as much as a million billion billion (10e24) joules of energy in the matter of a few minutes. General
What causes Solar Flares? • A coronal loop is a magnetic loop that passes through the corona and joins two regions of opposite magnetic polarity in the underlying photosphere. • Since the corona is ionized, particles cannot cross the magnetic field lines. Instead the gas is funneled along the magnetic field lines, which then radiate and form the loop structures we see at EUV wavelengths Coronal Loops TRACE image of coronal loops
What causes Solar Flares? • The differential rotation of the sun and the turbulent convection below the corona conspire to jumble up the footpoints of coronal loops, which distorts the loops above. • If two such oppositely directed coronal loops come into contact they can reconnect to form less distorted loops, and releasing any excess magnetic energy to power a solar flare Courtesy of the Philosophical Transactions of the Royal Society
Postflare Loops • After reconnection, some of the energy is released outward away from the sun and goes into accelerating particles. • The rest of the energy streams down the newly formed field line into the chromosphere, where plasma there is evaporated back into the loop. As the loop cools, the plasma condenses back into the chromosphere, while a new loop is formed above from the continued reconnection.
-Active Region 11092 • -N13 E21 • (-331’’,124’’) • August 1st 2010 • C-class flare • Flares classified by X ray flux we receive at Earth • X class receive the largest • M class receive 10 x less than X • C class receive 10 x less than M Specific Flare
SDO: AIA • The Atmospheric Imaging Assembly on board the SDO observes the corona in 7 EUV and 3 UV wavelengths every 10 seconds. • AIA images span up to 1.28 solar radii, with a resolution of 0.6 arcsec/pixel. • In particular, the 6 EUV lines from Fe provide a detailed temperature map of the corona from 1MK up to 20 MK. Atmospheric Imaging Assembly (sdo.gsfc.nasa.gov)
Two Wavelengths Emission from Fe IX at 171Å Emission from Fe XVI at 335Å
Obtaining Data from AIA In order to study this flare I began by tracing out as many individual loops as I could see in the AIA images.
Obtaining Data from AIA • Total Number of Loops: • 169 • Average Length: • 71.3216 arcseconds • 52.1432 Mm • Average Lifetime: • 0.303 hours ~ 18.2 minutes • Total Number of Loops: • 128 • Average Length: • 83.9599 arcseconds • 61.3831 Mm • Average Lifetime: • .686 hours ~ 41.2 minutes 171 Å ~ 1 MK 335 Å ~ 3 MK
Obtaining Data from AIA • From the graph above you can see quite clearly that the cooling delay from ~3MK to 1MK is approximately 0.5 hours.
Radiative Cooling All 171 Loops All 335 Loops
Electron Density • Using these basic physical relationships taken from Aschwanden et al. 2003, I calculated the number density from our observed cooling delay of ~ 30 minutes.
Electron Density • Once we have the number density, it’s a simple matter of backtracking in our equations to find and radiated power density and the energy released. • Note how both the power and energy are limited by the volume of the loops.
Stack Plot • From the stack plot it’s possible to withdraw the intensity of a single loop over time. With this information we can estimate the diameter of the loop using the equation from Longcope et. al. 2005
Loop Diameters and Volumes • One way to get the diameter of a loop is to use it’s intensity taken from the stack plot and substitute into the equations below.
Energy and Power • The first loop appears at 8.40676 (8:24) and the last loop disappears at 11.9967 (11:59), giving a total duration of ~3.5 hours. The energy above only gives a time of 45 minutes if the loops radiate with constant power.
EBTEL EBTEL uses different input parameters to calculate the number density and temperature response to a given input heating. Here my inputs were: 52.1432 Mm length 0.692 e9 number density
EBTEL Here I fiddled with different heating functions until I found one that gave a time delay of 30 minutes. With the parameters of my loops, I found a heating function of at least 2.6 would give the expected time delay.
EBTEL • The heating function is added in as a triangle wave. • This means the energy added can be estimated by finding the area of that triangle. • The energy added should equal the energy radiated away. (uh oh) It’s above the energy given off by the loops by 2 orders of magnitude.
To the Future! • Heating Function / Energy discrepancy • Decay Phase of Flare • Still more data: • 335Å ~ 3 million K • 94 Å ~ 6 million K • Total Flux/ Individual Flux
References • Aschwanden,M.J., Schrijver, C.J., Winebarger, A.R., & Warren, H.P.:2003, ApJ, 588, L49 • Longcope, D.W., Des Jardins, A.C., Carranza-Fulmer, T., Qiu, J.:2010, Solar Phys, 107 • Longcope, D.W., McKenzie, D.E., Cirtain, J., Scott, J.:2005, ApJ,630,596
Thank You • Dana Longcope • MSU Solar Physics • Jiong Dave Silvina • NSF • The Sun