Download

1 / 15
150 likes | 305 Views
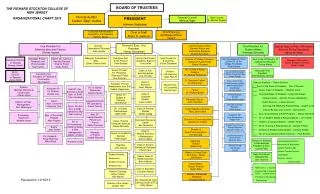
Board of Trustees Quarterly Data Report Volume 1, Series 1. Enrollment Update October 15, 2013. Enrollment Comparisons. Fall 2012 Total Enrollment :16,452 Minority Enrollment: 26.44%. Fall 2013 Total Enrollment:16,358 Minority Enrollment: 27.58%. Enrollment Comparisons.

E N D
Board of Trustees Quarterly Data Report Volume 1, Series 1 Enrollment Update October 15, 2013
Enrollment Comparisons Fall 2012 Total Enrollment:16,452 Minority Enrollment: 26.44% Fall 2013 Total Enrollment:16,358 Minority Enrollment: 27.58%
Enrollment Comparisons Fall 2012 Freshman Class SAT1212 ACT 26.07 GPA 3.89 Applied 6,797 Admitted 2,846 41.87% Enrolled 805 28.29% Local Area 412 51.18% Out of Area 393 48.82% Fall 2013 Freshman Class SAT1214.6 ACT 26.01 GPA 3.94 Applied 7,199 Admitted 3,189 44.30% Enrolled 807 25.31% Local Area 406 50.31% Out of Area 401 46.69%
Enrollment Comparisons New 2012 Transfers Applied 4,630 Admitted 2,746 59.31% Enrolled 1,772 64.53% Local Area 1,385 78.16% Out of Area 38721.84% New 2013 Transfers Applied 4,225 Admitted 2,51459.50% Enrolled 1,67166.47% Local Area 1,28479.41% Out of Area 33320.59% New 2012 Grad Students Applied 1,738 Admitted 652 37.51% Enrolled 43767.02% Local Area 28765.68% Out of Area 15034.32% New 2013 Grad Students Applied 1,822 Admitted 751 41.22% Enrolled 50366.98% Local Area 32163.82% Out of Area 18236.18%
A Decade of Change Fall 2003 Headcount14,064 Part-time 5,291 37.62% Full-time 8,773 62.38% Students’ Age 18-24 9,177 31-502,205 Fall 2013 Headcount16,358 Part-time 5,55833.98% Full-time10,800 66.02% Students’ Age 18-2411,208 31-50 1,947
A Decade of Change Fall 2013 Gender Male7,21544.12% Female 9,14155.88% Ethnic Diversity White 69.81% Minority 27.58% Degrees Awarded Undergraduate 3,221 Graduate 582 Fall 2003 Gender Male 5,783 41.12% Female 8,281 58.88% Ethnic Diversity White 74.22% Minority 19.80% Degrees Awarded Undergraduate2,107 Graduate 597
A Decade of Change • FTIC Application Trend • (Fall and Summer)
A Decade of Change FTIC Fall GPA Trend
A Decade of Change FTIC Fall SAT and ACT Trends
FTIC Enrollment Goals 2014-2015 SemesterAnticipated # of Students Summer 2014 800 Fall 2014 1,000 Spring 2015 100 Total 1,900 Fall 2014 Target Profile SAT 1217 ACT 26.5 GPA 3.95
Financial Aid by Type 2013 Awards Paid to Date 2012 Awards Paid to Date Classes started one week later in 2013. Awards paid to date reflect one week of fewer disbursements than in 2012.
Financial Aid by Type Scholarships Loans Grants
Bright Futures Trends Students Paid by Scholarship
Bright Futures Trends Amount of Aid Paid by Scholarship