Download
1 / 23
230 likes | 378 Views
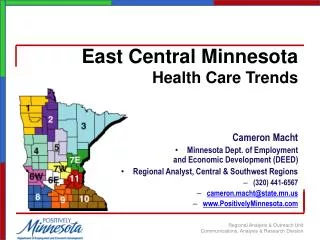
East Central Minnesota: Social and Economic Trends and Implications, Forestry Analysis. James Skurla Richard Lichty William Fleischman June 24, 2004. Study area: East Central Region Counties in Minnesota. Social and Economic Framework.

E N D
East Central Minnesota: Social and Economic Trends and Implications, Forestry Analysis James Skurla Richard Lichty William Fleischman June 24, 2004
Social and Economic Framework • Social and economic variables provide a framework within which landscape management can be developed • Limitations from the landscape ecosystem on levels of human activity: • attempts to restore natural features • importance of similarities • importance of heterogeneity across the East Central Landscape for developing policy that is based on differences • Natural Resource planning requires: data, natural, physical, and social/economic data. • set of over-arching goals is critical. • ways in which the natural, physical and social/ economic data interact
Landscape management considerations: • ways in which residents see the natural resources • how and what residents value about natural resources • how dependent residents are on specific resources for their livelihood and/or recreation
Landscape management considerations (cont.): • Residents’ willingness and capacity to participate in a policy development process • Residents’ “lifestyles and opportunity structures” • amount and type of “social capital” in communities • ability, willingness, and capacity to “adapt to changes” in the ecosystem
County Population Differences • Larger population counties are closer to the Metropolitan Area • Counties with larger urban populations are closer to the Metropolitan Area • Counties with larger rural populations are more distant from the Metropolitan Area • Levels of change: Seven of the East Central Region counties have net migration rates 3 to 8 times higher than the Minnesota rate • Rate of increase: Some counties doubled and one tripled in population over the past 40 years with increases between 10,000 to 20,000 in the past 10 years.
County Map Outline with In/Out Totals Source: Bureau of Business and Economic Research
Population Location of East Central MN CountiesRanked by Percent Rural Source: UMD BBER; Census SF3
County Population Differences (cont.) • Age structure: Counties with smaller populations tend to have higher median age for the county • Larger counties tend to have larger percentages of the population in the “labor force” range (18 – 65 years) • Income levels: Counties closer to the Metropolitan Area have higher median household incomes • Four counties (Kanabec, Mille Lacs, Morrison, and Pine) have between 9 and 11 percent of the population below the poverty level. • Persons per household: Average household size, between 1970 and 2000 dropped for all counties of the East Central Region. The ranking of percentage change in these years shows that Benton and Morrison dropped household size the most—as much as one person per household—and Sherburne and Chisago dropped the least, around .5 persons per household.
Housing • The number of housing units varies along the lines of population size but the number and percent of vacant housing units follows an inverse trend. • Counties with smaller populations tend to have higher percentages of vacant housing units. • The percent of vacant housing units which are seasonal, recreational, or occasional use are higher in the less densely populated counties. • Pine County has the highest percentage of vacant housing units and the highest percentage of vacant housing units which are seasonal, recreational, or occasional use.
Legend Urban and Rural Dev. Cultivated Hay/Pastures/Grassland Brushland Forestland Water Bog/Marsh/Fen Mining Source: Classified Satellite and aerial photographs from the 1990’s http://www.frc.state.mn.us/Landscp/5/assess/ec_assess_03_01.pdf
Land Use • Counties vary in size. Pine county is almost three times larger in total acres than five of the other counties. Morrison is about 66 % as large as Pine, and Wright and Mille Lacs are about one half the size • Settlement and accompanying land use patterns vary across the counties. Urban and Industrial uses vary from almost 9,000 acres in Wright county to between 1300 and 2200 acres in Kanabec, Mille Lacs, and Pine counties – these three counties rank lowest in the number of acres for Farmsteads, Rural Residences and Rural Residential Development
Land Use (cont.) • Land use patterns vary across counties not only in amount but in distribution - Chisago county has some “forest” but it tends to be concentrated along the eastern border. Wright county has some “forest” but it is highly fragmented • Counties vary by the percent of land classified as “forest, grassland, water/wetland, cultivated land. Pine county has the largest total acreage of “forest”, with Kanabec, Mille Lacs, and Morrison following in decreasing amounts.
Summary of East Central Region’s Economic Base: Analysis of the Region • This analysis looked at three measures for the East Central Region • Output = production of goods in millions of dollars • employment • value added = compensation in millions of dollars • Regional industries are also ranked according to relative importance (as compared to the State), and for growth trends.
1) What are the largest industries in the Region? • Largest employers in the Region: [Employment - The number of part and full time employees employed by the industry, sometimes referred to as “covered employment,” by the Bureau of Labor Statistics.] • State and Local Government-Education • Eating and Drinking • Amusement and Recreation Services • Largest production of goods and services in the Region: • [Output - The sum of intermediate sales to other regional • firms plus sales to final users of the product.] • New Residential Structures, • Electric Services and • Banking • Largest compensation in the Region: • [Value Added - The local earnings from various industry • productions. (The sum of employee compensation and • property income.)] • Electric Services • State and Local Government-Education • Banking
2) What are the most concentrated industries in the Region (compared to the State)? • The Forestry/Wood Products industries are extremely well represented in the industry ranking, showing that these industries are more densely represented in the East Central Region than elsewhere in the State.
3)What are the fastest growing industries in the Region (compared to the State)? Note the tourism related sectors of Amusement and Recreation Services, N.E.C. and Eating & Drinking are listed here as among the fastest growing employment sectors.
Forest Products • Which forest products industries are most densely concentrated and fastest growing in the Region? Most densely represented forest products industry sectors are: • Paperboard Mills, Veneer and Plywood, Wood Kitchen Cabinets, and Woodworking Machinery. • These industries are all heavily represented in the top ten concentrated industries rankings, when compared to the State. They are deeply embedded in the structure of the Region’s economic base. Although they are concentrated in the Region, they are not fast growing industries.
From the top hundred industry sector rankings for fastest growing industries in the East Central Region, using the employment measure, only some Forestry/Wood Products industry sectors are represented and are ranked as follows: Rank Industry Sector 1 Hay and Pasture 2 State & Local Government - Ed 3 Amusement and Recreation Services, N.E.C.* 4 Eating & Drinking* 5 Accounting, Auditing and Bookkeeping 24 Furniture & Home Furnishings Stores 26 Forest Products 38 Wood Kitchen Cabinets 60 Millwork 77 Structural Wood Members, N.E.C 89 Veneer and Plywood 98 Woodworking Machinery 102 Wood Products, N.E.C
Forest Products (cont.) *Note: Although Forestry/Wood Products industries do not rank in the top ten fastest growing industries, recreation and tourism, which depend on the forested landscape, are represented in fast growing employment industries. For instance in the top ten ranking for fastest growing are 3rd ranked Amusement and Recreation Services, N.E.C., and 4th ranked Eating & Drinking, both part of the “hospitality industry” and related to tourism.
Regional Profile Highlights • Electric Services are high in value added and output, but low in employment. • Out of the top 25 employers, four of them are in the Medical and Care industries. • State and Local Government-Education is a very important industry, in terms of employment, value added and output. Also true of the Medical and Care industries, which include: Hospital, Residential Care, Nursing And Protective Care, and Doctors And Dentists. • Tourism also plays an important role in the economy, as shown by the strength of the Amusement and Recreation Services and Eating and Drinking sectors. • Wholesale and Retail Trade along with Banking and Construction are strong sectors in the East Central Region. • Forestry/Wood Products industries are densely concentrated in the Region compared to elsewhere in the state.
For more information, please contact: Bureau of Business and Economic Research Labovitz School of Business and Economics University of Minnesota Duluth 412 Library Drive Duluth, MN 55812-2496 phone: 218 726-7244 fax: 218 726-6555 For questions about the economic analyses, please contact: Jim Skurla, Acting Director Bureau of Business and Economic Research The full report is available on the www at: http://www.d.umn.edu/sbe/departments/bber/projects/projects.htm