Download
1 / 33
330 likes | 512 Views
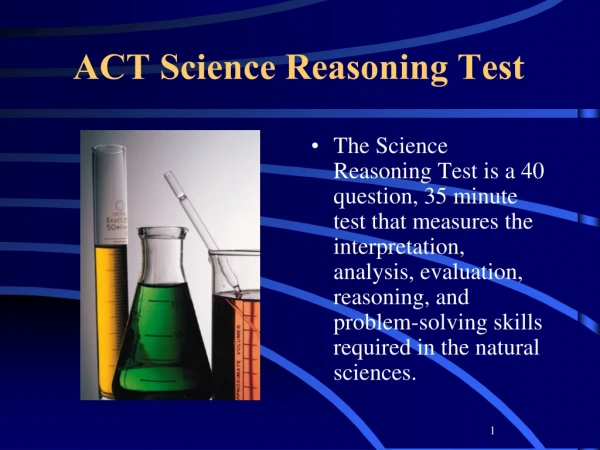
Getting to Know the ACT Science Test. 40 Questions 35 Minutes , timed test The test emphasizes scientific reasoning skills over recall or science content ,interpretation , reading ability and logical thinking. Data Representation (38% of items).

E N D
Getting to Know the ACT Science Test • 40 Questions • 35 Minutes , timed test • The test emphasizes scientific reasoning skills over recall or science content ,interpretation , reading ability and logical thinking
Data Representation (38% of items) • This format presents graphic and tabular material similar to that found in science journals and texts. The questions associated with this format measure skills such as graph reading , interpretation of scatterplots , and interpretation of information presented in tables , diagrams and complex figures.
Research Summaries (45% of items) • This format provides descriptions of one or more related experiments. The questions focus on the design of experiments and the interpretation of experimental results.
Conflicting Viewpoints (17% of items) • This format presents expressions of several hypothesis or views that , being based on differing premises or on incomplete data , are inconsistent with one another. The questions focus on the understanding , analysis and comparison of alternative viewpoints or hypotheses.
College Readiness Standards-Science • Interpretation of Data • Scientific Investigation • Evaluation of Models , Inferences and Experimental Results • See handout for more details
Review College Readiness Science Standards • Handout • What do you see ?
Time Management , 35 minutes • 1 passage, conflicting viewpoint , 7 questions , 6 minutes • 2 passages , research summary , 6 questions, 5 minutes each passage , students to time practice tests • 4 passages , data rep., 5 questions each , 4 minutes each passage
Data Representation Passages , Test-Taking Strategies • Highlight keywords , use the diagrams , answer the question • Find the Keywords , highlight them if needed • What do you know ? • Keywords tell us three things: The name of the diagram ,the data point or trend , the title of the column or axis
Keyword Clues • Directly proportional: 2 trends that increase or decrease together , Air pollution is directly proportional to the # of cars… • Inversely proportional : 2 trends ,one increases as the other decreases , The # of mice is inversely proportional to the # of snakes… • Ratio , compares one data point to another, The ratio of female to male tortoises is 3:2…
Keyword Clues • Consistent , implies that the trend follows the same pattern shown in the figure, Is the information below consistent with the findings of Scientist 1? • Most likely , indicates that you will be predicting a value beyond the range of the graph , If the algae doubled , the amount of Oxygen would most likely…
Keyword Clues • Expect, indicates that you will be predicting a value beyond the range of the graph , If the temperature dropped 20 C, the frogs would be expected to… • Respectively , indicates that items are listed in the order they are described, The 1st and 2nd fossils were 5 & 2 million years old , respectively…
Use the Diagrams • Use the keywords to select the correct heading from the correct diagram • Find the data point or summarize the trends • If the information is not in the table , read the text above the table
Answer the Question • Match the information from the diagram to one of the answer choices • Check that the text you have underlined and your analysis of the diagram supports your answer
Tables and Figures • Use same strategies as with Data Rep. questions • Are you Trendy , look for Trends in the data , look for order. • The ACT often will not list data in increasing or decreasing order , but the answer is there
Unfamiliar Data Formats on the ACT • Read any type of graph by using the axes and labels to follow the same steps for simpler figures • Review Scatter Plots : they show each data point separately . Sometimes trends are found in clusters ,or they may approximate lines
Data Formats • Vertical Line Graphs , sometimes line graphs that represent depth are presented vertically. These line graphs are just like the line graphs you have seen before. • Shaded tables , may or may not contain numerical data , the important data to collect is whether or not the box is shaded
Data Formats • Working with Multiple Axes • Line Graphs with Multiple Scales, line graphs may have units labeled on two y-axes or two x-axes , use the key to determine which trend to look at , then use the axes to determine which scales to use
Multiple Sets of Data • Tables may also mix many types of information , read the table from the outside in , helps students understand the grouping of different rows within the table
Data Representation Examples , Activities • Flip Charts , examples • Station 6 , example , shark data • Salem’s Secret , case study
Making Predictions , Using Patterns • Some ACT questions will ask you to predict data based upon a trend. This may involve extending the trend beyond the highest or lowest data point , or predicting a new point between two other points , if there are no lines in the area of the graph for which you are predicting , use the edge of a sheet of paper to draw a straight line to connect the points & extend them beyond the edges of the graph.
Research Summaries , Understanding Experiments • The ACT may ask a few questions about the procedure of an experiment , in general these questions will ask you to predict what will happen when experimental conditions are changed • Analyzing the Experiment: Independent , Dependent Variable , the Control
Independent Variable : is what the experimenter wants to know more about, ACT may refer to this as the “ factor that is varied” Dependent Variable: is what is measured , ACT may refer to this as the “ factor that is not directly controlled” Control : is the trail or group that is normal , it is used to calibrate the equipment or show that the indep. var. had an effect , ACT may ask why it is present in the experiment.
Comparing New Experiments • A scientist must always look for new evidence. Part of the scientific method involves using the results of one experiment to design a new experiment or examining how the results of a new experiment influence existing theories • ACT may ask you to identify which areas have not been covered by an experiment , sometimes the answer is there is not enough information to answer the question.
Thinking Like a Scientist : Activity • Seeking Solutions , 3 Scenarios • Read and brainstorm explanations and use the explanations to form several possible hypotheses , then develop one or more experiments to test your hypotheses.
Experimental Design Questions • Usually Big Idea questions that may include: • Explain how changing the design would change the results • Explain how changing one part of the design would change another part of the design • Explain why parts of a design were performed • Id the figure that illustrates the Exp. Design • Id problems that could cause errors in results • Id new exp. that would give better info.
Complex Figure Questions, Reading Graphs • Reading Graphs • The Bar and Scatter Plots in the question usually do not have scales marked on their axes , the general shape of the data is very important • Determine which values are greater or lesser and how much greater or lesser each data point is in comparison to others
Using Information from Two Figures • The ACT asks questions in which data from one table or figure must be used to get information from another table or figure , to address these questions , treat each table as a separate problem • Determine the correct data point , trend or table from the 1st table and apply to the 2nd
Solving Equations • Most ACT exams have 1 or 2 questions with equations • Simple addition , subtraction , multiplication & division , no calculator use on exam • Write the equation , read the text around the equation , write down what each variable stands for • Find the value of each variable , plug it in , determine which answer matches results
Conflicting Viewpoints Questions • Different scientist often arrive at different conclusions when presented with the same set of observations • Students must understand that different interpretations exist , they must develop strategies to compare/contrast conflicting viewpoints • Conflicting view points passages present 2 different explanations for the same evidence
Viewpoint Strategies • Students will be asked to clarify each person’s viewpoint , give information that will support or disprove a viewpoint , comparing ideas of the two other people • Summarize the passage & scan key words • Answer the easier questions first • Answer questions about multiple viewpoints . Students are likely to miss these , takes longer to digest , time wasted ?
Mapping the Genetic Code Activity , Article • Read the N & O article • Respond to the questions , discuss with your table group • Reactions ?
General Exam Taking Tips • Do not over analyze • There is only one right answer , it’s there • Practice Test with a stop watch • One correct answer equals one point • No points for finishing early • Guess smart , eliminate some answers • Be trendy , notice trends in the data