Download
1 / 18
180 likes | 305 Views
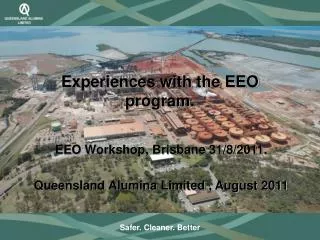
POTTERS INDUSTRIES EEO DATA ANALYSIS PROGRAM. Potters Industries is part of the internationally owned PQ Corporation. The PQ C orporation is the world’s largest silicate manufacturer and a major player in the engineered glass bead market

E N D
Potters Industries is part of the internationally owned PQ Corporation The PQ Corporation is the world’s largest silicate manufacturer and a major player in the engineered glass bead market PQ Corp. spans over 50 countries employing more than 3000 people The 3 local (Australian) manufacturing facilities are split into two business units , “Industrial Chemicals” and “Engineered Glass Materials” EGM Glass Beads Sunshine Hollow Microspheres Dandenong Industrial Chemicals Alkali Silicates Dandenong Sydney The Dandenong facility operates in 24/7 while the Sunshine and Sydney facilities are 5 day operations. Combined, the sites employ approx. 65 personnel Who are Potters Industries
History Energy is a major operational cost and accordingly energy reduction programmes have been a focus for the business for >10years As a result, some energy monitoring and analysis systems were in place prior to the EEO program and many projects had already been completed Systems Existing Monthly data capture (Essentially Total Energy Use Only) Live process data but NOT energy capture Data Analysis - such as measuring production efficiencies vs. costs Energy History & Data Systems
Our Approach The EEO program guidelines provided the outline of our approach by ensuring the following actions:- • Gaining “Commitment” from Senior Management • Establishing an “Energy Team” • Developing a Program Plan covering the “Key Elements” of the Program • Establishing “Program Structure” • Setting “Timelines” for actions
Energy Management Groups For each Business sector we established Steering Management Groups which included an Energy Management Champion to ensure the overall program did not stall. Each Team had responsibilities and accountabilities assigned. Example:
Project Phases We utilised an existing model for the project. This model similar to the EEO Model Each of these project parts have tools associated with them (Not Discussed Here)
Planning & Support Systems To ensure the program was controlled we established a Project Plan and had existing support systems to assist manage any information developed such as:- • Policies • Procedures & Instructions • Records or Data Information Without these systems we may not have been able to complete the program in the timeframe we did
Due to an internal personal change Potters joined the EEO program late and we’re behind schedule in data collection. Establishing the Baseline To enable analysis of usage patterns and identify the operational areas of greatest opportunity Potters embarked on a rigorous 3 month data collection program. • A log of all equipment which utilized electricity was generated. • This log encompassed both operations and support and included every item from major cooling fans down to the coffee machine. • The energy rating (kwh) was recorded against each item and for those with VSD operational trends were analysed. • Data collection templates were generated for each part of the operation (Sales, Laboratory, Logistics, Furnace, Dissolvers, etc.). • Every staff member on site was responsible logging equipment use in their area on an hourly basis. It should be noted however that most staff updated once daily based on best recollection. Data Collection
Establishing the Baseline (continued) After 3months of data collection we had gathered nearly 1.2million data points. Data Collection
Establishing the Baseline (continued) The data was compiled and the total energy use for both electricity and gas was compared against the supplier invoiced quantities. Despite inaccuracies involved in manual collection the relative usages aligned very closely for both natural gas and electricity. * Sydney was not included due to the relative size and energy use. Due to the good alignment it was agreed this data could be considered a valid representation of energy use patterns. Data Collection
Establishing the Baseline (continued) Trend data was used to isolate events that may skew data, for example, maintenance shutdowns, breakdowns, etc. Data Analysis - Trending
Operational efficiency for each product type was also conducted using trends. This information allowed costs to be assigned to products which in turn could be used to develop sales and marketing strategies Trending also showed the benefits of timer controlled heating in administrational areas. Clarified the relationship no link between shift and efficiency. Data Analysis - Trending
Establishing the Baseline (continued) Once the data was cleaned we used Pareto Analysis to confirm the areas which consumed the most energy. Unsurprisingly the furnace operation accounted for 59% of the energy with the Hollows operation accounting for 35%. Data Analysis - Pareto
Pareto charts were used to rank the energy use of specific parts of each operation and help focus energy saving efforts. The operation burners accounted for 92% of all energy use Data Analysis - Pareto
We used correlations to examine possible links and preconceived ideas about energy use such as perceived links between ambient temperature and operational efficiency. Is there value in running more during the day? Correlations between operational conditions and energy input were also explored. One example was the link between Tower pressure and burner set points. Managing Pressure better allows lower set points and less energy input Data Analysis - Correlations
The Pareto clearly showed that the most value could be obtained by reducing gas use in the burners with a secondary focus on major motors and compressors Projects identified for further investigations as a result of the program were as follows: Waste heat boiler Furnace Heat Recovery Hollows Heat Recovery Push Fan Replacement Complete Office Heating/Cooling Hollows Burner Replacement Boiler Burner Control Upgrade Suction Fan Proposed for 2013 Furnace Burner Design Ongoing Projects