Download
1 / 1
10 likes | 98 Views
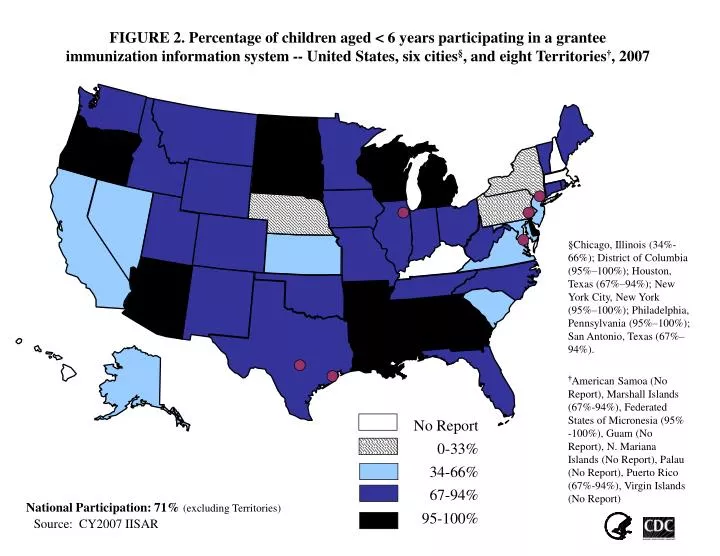
FIGURE 2. Percentage of children aged < 6 years participating in a grantee immunization information system -- United States, six cities § , and eight Territories † , 2007.

E N D
FIGURE 2. Percentage of children aged < 6 years participating in a granteeimmunization information system -- United States, six cities§, and eight Territories†, 2007 §Chicago, Illinois (34%-66%); District of Columbia (95%–100%); Houston, Texas (67%–94%); New York City, New York (95%–100%); Philadelphia, Pennsylvania (95%–100%); San Antonio, Texas (67%–94%). †American Samoa (No Report), Marshall Islands (67%-94%), Federated States of Micronesia (95% -100%), Guam (No Report), N. Mariana Islands (No Report), Palau (No Report), Puerto Rico (67%-94%), Virgin Islands (No Report) No Report 0-33% 34-66% 67-94% 95-100% National Participation: 71% (excluding Territories) Source: CY2007 IISAR