Download
1 / 46

E N D
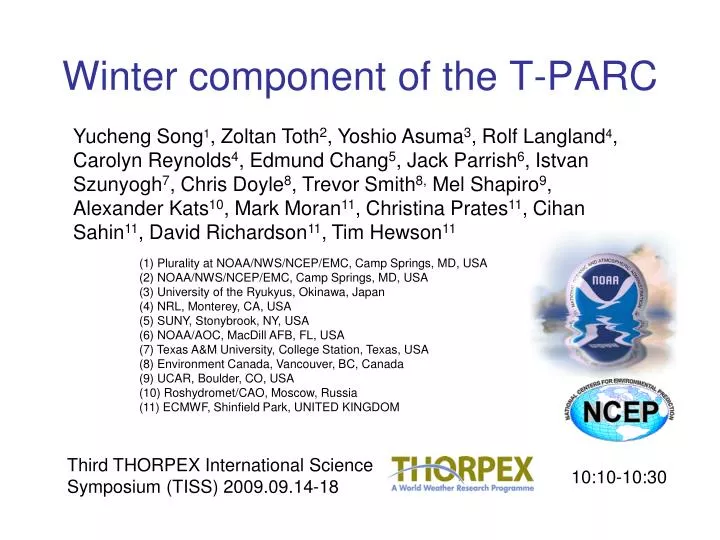
Winter component of the T-PARC Yucheng Song1, Zoltan Toth2, Yoshio Asuma3, Rolf Langland4, Carolyn Reynolds4, Edmund Chang5, Jack Parrish6, Istvan Szunyogh7, Chris Doyle8, Trevor Smith8, Mel Shapiro9, Alexander Kats10, Mark Moran11, Christina Prates11, Cihan Sahin11, David Richardson11, Tim Hewson11 (1) Plurality at NOAA/NWS/NCEP/EMC, Camp Springs, MD, USA (2) NOAA/NWS/NCEP/EMC, Camp Springs, MD, USA (3) University of the Ryukyus, Okinawa, Japan (4) NRL, Monterey, CA, USA (5) SUNY, Stonybrook, NY, USA (6) NOAA/AOC, MacDill AFB, FL, USA (7) Texas A&M University, College Station, Texas, USA (8) Environment Canada, Vancouver, BC, Canada (9) UCAR, Boulder, CO, USA (10) Roshydromet/CAO, Moscow, Russia (11) ECMWF, Shinfield Park, UNITED KINGDOM Third THORPEX International Science Symposium (TISS) 2009.09.14-18 10:10-10:30
Outline • Motivations • Operations • Preliminary evaluations • Summary
CASE DEPENDENT, ETKF-BASED ANALYSIS OF THE INFLUENCE ON THE WINTER STORM March 04 March 05 March 06 March 07 Verification event March 11 Sharan Majumdar
20 more times bigger errors than initial condition error after 5 days GFS “dropout” case
a) The time-mean geopotential height of the 300-hPa surface for (a) WSR99 and (b) WSR00. The sample period starts at 0000 UTC 13 Jan 1999 for WSR99 and at 0000 UTC 23 Jan 2000 for WSR00. Shown by shades is the daily amplification of the most unstable baroclinic mode (Eady index) for the time-mean flow in the 850–925-hPa layer. Dropsonde locations are shown by crosses b) Szunyogh et al. 2002, M.W.R Storm track regions are most unstable regions
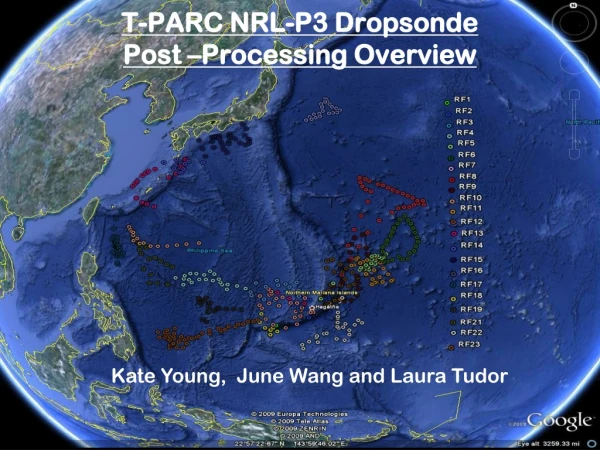
ENHANCED OBSERVING PLATFORMS Extensive observational platforms during T-PARC winter phase allow us to track the potential storms and take additional observations as the perturbation propagate downstream into Arctic and North America Day -4-6 RAWIN Russia Arctic VR North America VR Day -5-6 E-AMDAR D -1-3 C-130 G-IV D -2-4 G-IV
Collaborative efforts of winter T-PARC among multi-agencies CONTRIBUTORS / PARTICIPANTS • Funding for observing assets • NOAA, Env. Canada, Roshydromet, Japan • Science / operational aspects • US, Canada, Mexico, Russia, Japan, ECMWF/UKMO (including Universities and Institutions) • Data archiving • NASA Langley Research Center Ackn: John Murray and Jared Entin (NASA)
The main website is the central place for forecast products and discussions A plethora of products have been used to provide sound guidance to the adaptive platforms • Significant amount of coordination among different participants • Track redesign due to length change or weather pattern changes • Different time zones • Air traffic control • “Lost in translation”
Requests from HPC/SPC/OTHERS - example 46N 148E at 21/12Z Asian low 50N 128W at 23/00Z Vancouver area Priority Valid Time Area Remarks High 02/22-24/12z 40N 123W West coast pcpn Moderate 02/22/00z 39N 80W Eastern US system 02/23/00z 42N 72W Moderate 02/24/00z 35N 90W MS-TN Valley pcpn 02/25/00z 35N 87W High.......02/23/00Z...33N/83W....Upper trof supporting psbl E coast storm Medium.....02/23-24/00Z...40N/122W....CA precipitation
Our tool to design the tracks based on overlaid summary chart onto Google map Today’s run +36
Google earth is widely used for track display and distance measurement G-IV and C-130 tracks on Feb 13, 12Z
Comparing sensitivity charts with short lead forecasts – as a reference to design the tracks A sound check with short lead time forecast
After flight check - track overlaid on MTSAT maps Courtesy of Dr. Asuma Yoshio Surface pressure and 500mb geopotential height
Wave packet analysis used as a reference timing and location From Edmund Chang Wave packet from analysis
The tireless G-IV crew and their tracks T-PARC/WSR09 tracks NOAA AOC G-IV crews for T-PARC
Overall results for Surface pressure(T-PARC 2009) In certain cases, significant RMS reductions are observed as high as 35%
Surface Pressure RMS vs. Fcst Hours ~10-20% rms error reduction in winds RMS error reduction vs. forecast lead time
Vector Wind RMS vs. Fcst Hours ~10-20% rms error reduction in winds Beyond 4 days RMS error reduction vs. forecast lead time
T-PARC Summary statistics 39 OVERALL POSITIVE CASES. 13 OVERALL NEGATIVE CASES. 75% improved 25% degraded OVERALL EFFECT:
Wild West -- The worst weather on this Presidents Day Monday is in California, where rain, snow and wind are pounding most of the state. Flood watches have been posted for coastal areas while winter storm warnings are in effect for most of the eastern part of the state. The worst of the storminess will end later today, as the system moves into the Great Basin overnight and Tuesday. That same storm will eject into the middle and southern states by later Tuesday and Wednesday. Feb 16, 2009 from USATODAY Up to two meters of snow had fallen in the Sierra Nevada over the past week Review the Feb 13, 12Z missions
Wild West -- The worst weather on this Presidents Day Monday is in California, where rain, snow and wind are pounding most of the state. Flood watches have been posted for coastal areas while winter storm warnings are in effect for most of the eastern part of the state. The worst of the storminess will end later today, as the system moves into the Great Basin overnight and Tuesday. That same storm will eject into the middle and southern states by later Tuesday and Wednesday. Feb 16, 2009 from USATODAY Up to two meters of snow had fallen in the Sierra Nevada over the past week
March 1, 2009 CA Storm • Weather event with a large societal impact • Each GFS run verified against its own analysis – 60 hr forecast • Impact on surface pressure verification • RMS error improvement: 35.2% • (7.07mb vs. 9.56mb) • Targeted in high impact weather area marked by the circle Surface pressure from analysis (hPa; solid contours) Forecast Improvement (hPa; shown in red) Forecast Degradation (hPa; blue)
March 1, 2009 CA Storm Forecast improvement Red: forecast improvement Globally averaged fit of surface pressure: Difference of forecast-analysis
WHY T-PARC? The best example Major snowstorm roars up coast Atlantic coast braces for biggest snowstorm of the season March 2, 2009, heavy rainfall near CA on the 27th, Feb
Strong connection of the tropical and extra-tropical systems
TARGETED DROPSONDE IMPACT ON 24H FORECAST ERROR IN NOGAPS/NAVDAS Jan 20/12UTC high impact per-observation Summed impact of dropsonde observations (error reduction is NEGATIVE, units are J kg-1) Courtesy of Rolf Langland
JANUARY 2009 FEBRUARY 2009 Error Reduction Error Increase 1x10⁻³ J kg-1 (Moist Total Energy Norm) 1x10⁻³ J kg-1 (Moist Total Energy Norm) Total # of targeted radiosonde data = 27,508 (06UTC and 18UTC) Number of targeted radiosonde profiles = 247 (33 stations provided at least one profile) Total targeted radiosonde impact = -0.4322 J kg-1 For comparison: 00UTC and 12UTC observations from these same stations: -4.24 J kg-1 and 2,154 profiles during all of January 2009 Total # of targeted radiosonde data = 29,898 (06UTC and 18UTC) Number of targeted radiosonde profiles = 272 (33 stations provided at least one profile) Total targeted radiosonde impact = -0.6626 J kg-1 Courtesy of Rolf Langland
FEBRUARY 2009 JANUARY 2009 1x10⁻³ J kg-1 (Moist Total Energy Norm) Error Reduction Error Increase Total # targeted LH-EAMDAR ascent/descent data = 17,444 (12-31 January 2009) Total targeted LH-EAMDAR impact = -0.583 J kg-1 GLOBAL Lufthansa AMDAR ascent/descent impact = -2.89 J kg-1 and 113,151 data during all of January 2009 Total # targeted LH-EAMDAR ascent/descent data = 24,423 (1-28 February 2009) Total targeted LH-EAMDAR impact = -0.7663 J kg-1 Courtesy of Rolf Langland
Rossby wave packet analysis and IPY connection (3.4,4.4) Meso-scale storm structure and moist processes studies (4.1) Multi-scale tropical influences – YOTC (3.1,3.3,4.4) Data assimilation: best use of observations (4.2) Satellite data calibration/validation with in situ data (4.2) Adaptive targeting studies (4.3) Ensemble-based probabilistic forecasting & socio-economic applications - Winter Olympic Demo (4.5,5.1-5) A myriad of research interests in Winter T-PARCStrong mapping into the US THORPEX Science Plan ( 13 of 15 priorities) Field phase completed, data archived by NASA How to support post-field research/evaluation?
Data archive contribution by NASA-Langley Research Center Need user account to access Support sftp and scp for scripting purposes Please contact us: Yucheng.song@noaa.gov Data: satellite data conventional data cloud images with tracks Some DTS products Analysis and forecast (pressure level data) Web address: http://science.larc.nasa.gov/T-PARC/ Ackn: John Murray and Jared Entin (LARC)
Summary and Plans • Field phase successfully completed • Winter T-PARC marks the first time vertical profiling of winter storms conducted west of the dateline • Data archived at NASA (LARC) • A wide variety of research opportunities now open • An ideal framework for research studies such as • dynamical /physical processes • storm initiation/propagation • the role of moist processes • interaction of tropical convection with extra-tropical storms • Socio-economical impact studies • Need to identify funding resources for further research • Ongoing evaluation • NRL preliminary evaluation • large positive impact on the 24hr forecast • more than 90% of the data reduced forecast errors • NCEP data denial experiments • Full rejection (done) • Only rejecting the aircraft data (ongoing) • Propose a joint meeting with summer T-PARC next year
GDAS: 300mb v (ave:30-60N) PRX2: 300mb v (ave:30-60N)
PRX2-PRX4: 300mb v (ave:30-60N)
Sensitivity of 24hr Forecast to initial conditions JANUARY 2009 FEBRUARY 2009 Courtesy of Rolf Langland
WTPARC Targeted Observation Summary – NOGAPS/NAVDAS Impact on moist total-energy 24h forecast error norm in global domain January 2009 Impact# of obsAvg impact per-ob EAsian EAMDAR -0.5830 Jkg-1 17,444 3.34 x 10⁻⁵ Jkg-1 Dropsondes -0.6679 Jkg-1 27,444 2.43 x 10⁻⁵ Jkg-1 Russian Raobs -0.4332 Jkg-1 27,508 1.58 x 10⁻⁵ Jkg-1 (06z and 18Z) February 2009 Impact # of obsAvg impact per-ob EAsian EAMDAR -0.7663 Jkg-1 24,423 3.14 x 10⁻⁵ Jkg-1 Dropsondes -0.7176 Jkg-1 32,172 2.23 x 10⁻⁵ Jkg-1 Russian Raobs -0.6626 Jkg-1 29,898 2.22 x 10⁻⁵ Jkg-1 (06 and 18Z) Petropavlosk -0.2047 Jkg-1 3,396 6.03 x 10⁻⁵ Jkg-1 Courtesy of Rolf Langland
WTPARC Targeted Observation Summary – NOGAPS/NAVDAS Impact on moist total-energy 24h forecast error norm in global domain January 2009 Impact# of obsAvg impact per-ob EAsian EAMDAR -0.5830 Jkg-1 17,444 3.34 x 10⁻⁵ Jkg-1 Dropsondes -0.6679 Jkg-1 27,444 2.43 x 10⁻⁵ Jkg-1 Russian Raobs -0.4332 Jkg-1 27,508 1.58 x 10⁻⁵ Jkg-1 (06z and 18Z) February 2009 Impact # of obsAvg impact per-ob EAsian EAMDAR -0.7663 Jkg-1 24,423 3.14 x 10⁻⁵ Jkg-1 Dropsondes -0.7176 Jkg-1 32,172 2.23 x 10⁻⁵ Jkg-1 Russian Raobs -0.6626 Jkg-1 29,898 2.22 x 10⁻⁵ Jkg-1 (06 and 18Z) Petropavlosk -0.2047 Jkg-1 3,396 6.03 x 10⁻⁵ Jkg-1
Raob Station 32540 Petropavlosk Kamchatskoe (53.02N, 158.72E) Feb 2009 (very large forecast error reduction) Total Impact of all soundings = -0.4281 J kg-1 (10,320 data) Just the 06Z and 18Z soundings = -0.2047 J kg-1 (3,396 data)
Station 32540 radiosonde impact on 24H FORECAST ERROR IN NOGAPS/NAVDAS – Feb 2009 Number of Station 32540 radiosonde observations assimilated in NOGAPS/NAVDAS 6-hour assimilation windows Summed impact of Station 32540 observations (error reduction is NEGATIVE, units are J kg-1)