Download
1 / 52
520 likes | 695 Views
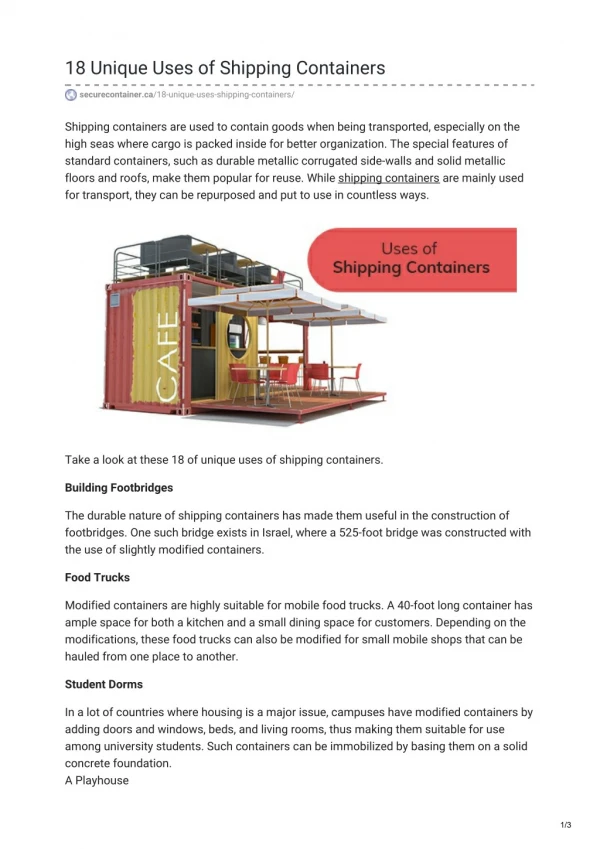
Sea Containers ltd. Investor Presentation New York June 9, 2005. David Benson Senior Vice President Chief Executive - Ferries. 2004 Divisional results. Major market changes Surplus capacity Fuel. Divisional results – 2004 EBITDA $m. Net asset value $1.47bn.

E N D
Sea Containers ltd. Investor Presentation New York June 9, 2005
David Benson Senior Vice President Chief Executive - Ferries
2004 Divisional results • Major market changes • Surplus capacity • Fuel
Divisional results – 2004 EBITDA $m Net asset value $1.47bn • After$2m Hovercraft spares write-off • Includes $10.7m re: IOMSPC EBITDA
Silja market segments • Transport • Cruising • Shopping • Restaurants • Freight
Fuel • Forecast consumption 2005 (tonnes) • Gas oil 87,500 • Heavy fuel 121,300 • Sensitivities • $10/tonne gas oil = $875k EBITDA • $10/tonne heavy fuel = $1.2m EBITDA
Action to improve Silja line (1) • Consider rationalising tonnage for Stockholm/Turku to reflect changing market conditions • Strengthen balance sheet by selling non-core tonnage • Winter charter arrangements or cheap lay-up for Finnjet • Consolidate fast ferry position on Helsinki/Tallinn • Refresh facilities on Serenade/Symphony
Action to improve Silja line (2) • Implement new purchasing system • $2.5m benefit in 2005 • Move Starwind to Stockholm/Turku route • $0.4m benefit in 2005 • Special charters Opera/Europa; $0.6m in 2005 • Fare price increases to cover fuel $2.6m in 2005 • Extend Walrus cruise ship charter, then sell for $30m • New reservations and online system $3.3m benefit 2007 • Consider outsourcing, review back office functions $5m benefit 2007 • Consider future of ticket offices and moving call centre $2.9m benefit 2007
Action to improve – other ferries • Close loss-making businesses • Belfast/Troon - done ü • Newhaven/Dieppe - done ü • Dover/Calais - under review • Migrate fast craft from N Europe to JVs in Adriatic and Mediterranean • Zarajet – Adriatic ü • Speedrunner1 – Aegean ü • Consider sale of older fast craft • Seastreak • Fine tune output • Increase prices • More parking • Charters
Summary • Build on the strength of the Silja brand • Rationalise Silja fleet and strengthen the balance sheet • Redeploy fast ferry assets • Overhead reduction
Christopher Garnett Senior Vice President Rail Division and Chief Executive GNER
Key Issues • 2004 • The new GNER franchise • The Kent franchise • Future franchises
GNER 2004 • Passenger income increased by 7% • Passenger volumes increased by 12% to 16.9m • Launched Wi-Fi Internet Broadband on trains • Completed station refurbishment programme • Settled claim with the SRA relating to Hatfield • Signed Joint Venture with MTR Corporation of Hong Kong to bid for the Integrated Kent franchise
The new GNER franchise • Started on May 1 2005 • 7 years + 3 years • Total cash investment $225m – SCL about $75m • The last 3 years 47% of the premium - do we want it? • We have to meet three performance targets: - Minutes delay to our trains - Train cancellation - Run full-length trains
Profitability of UK listed train companies • There are 5 UK train operators listed on the LSE • Their market caps average $1.8bn • Estimated P/E ratios are in the region 11 to 13 times • Outperformed the FTSE All Share by over 50% since May 2004
How did we bid? • Decide on passenger revenue In the last franchise: - GNER grew by 10% for 4 years - Then flat for 2 years - Then 9% for 2 years • Based on assessment of fares, rise in GDP, train service pattern etc, average growth 8.7% for 9 years
How did we bid? • Revenue protection There is a revenue share/support mechanism - Revenue between 102% and 106% shared 60/40 GNER/SRA - Revenue >106% shared 40/60 GNER/SRA • Revenue support zero in first 4 years then support between 98 and 94%, shortfall shared 50/50 with the SRA • Revenue <94% the shortfall is shared 20/80
How did we bid? • Calculate increases in costs - GNER’s total costs in 2004 were $794m - Total controllable operating costs $432m of which labour is $156m
How did we bid? • Rolling stock leasing and Track Access charges of $385m are pre-stated over the life of the franchise • We have assumed a growth in expenses, including profit of 4.3% p.a. with some reduction in operating costs going forward
The Kent franchise • Joint Venture 71% GNER – 29% MTR • MTR probably the best City Metro operator in the world • Kent bid to be submitted by the end of July • Three other bidders, but no incumbent • Decision late autumn • Large Government subsidy
Other UK franchises • Greater Western - did not qualify • South West Trains - pre qualify winter 2005 • Midland MainLine - spring 2006 • Virgin Cross Country - summer/autumn 2006
Angus FrewSenior Vice President Containers and President and CEO GE SeaCo SRL
Container Division Activities • Leasing • GE SeaCo • Sea Containers • Manufacturing • CMCI, USA • PCML, Brazil • YMCL, UK • Other Operations • Australasia • Brazil • Singapore Divisional Revenue 125.6 122.3 110.6 107.4 Divisional Operating Income 43.4 35.8 30.6 23.4
Revenue by Activity - Reported 125.6 US$ millions 110.6 107.4 Revenue growth driven by the Owens Group acquisition
Revenue Including GE SeaCo 269.4 209.2 176.3 US$ millions GE SeaCO revenue growth of 45.8% in 2004 • GES Containers is 100% of GE SeaCo owned fleet revenue
Operating Income (EBIT) by Activity 45.4 35.8 23.4 US$ millions EBIT growth of 26.8% driven by GE SeaCo
Shipping Industry • Supply and Demand • Congestion • Consolidation The 3 Hot Topics
Container trade vs. capacity Trade (demand) Fleet capacity (supply) Fleet growth expected to exceed trade growth in 2006 Source: Clarkson Research Studies May 05
Concentration and Consolidation Concentration Order book (Top 100) Global container fleet capacity in TEU The big are getting bigger….. Jan 05 Rev assumes merger of P&O NedLloyd and Maersk Source BRS- Alphaliner
Leasing Industry and GE SeaCo • GE SeaCo fleet share • GE SeaCo fleet performance • Key levers for 2005
Lessor operating fleets by asset value GE SeaCo is overall industry leader Source: Containerisation International Containers Leasing Market 2003
GE SeaCo operating fleet utilisation % All key equipment types at 90%+ GE SeaCo operating fleet includes all containers owned, leased in and managed by GE SeaCo
GE SeaCo key levers for 2005 • New equipment - budgeted at $250 million • Utilisation - maintain current levels • Cost reduction • operating cost, • S,G & A costs • Rate renegotiation • some opportunity, • term & rate
Ian Durant Chief Financial Officer
Finance • The team • Organisational changes
Financial framework Requirements for Enhancing Shareholder Value Insightful external disclosure Effective planning Support for capital allocation decisions Quality management information Focus on operational cash flow
SCL Group 2004 revenue by Division • Total group revenue $1.7bn
SCL Group total assets by Division 31 March 2005 • Total group assets $2.7bn
SCL Group 2004 EBITDA by Division • Total group EBITDA $198m • US GAAP treatment includes 50% of GE SeaCo EBT ($33m)
The challenges • Leverage • Cashflow structure • Ferry Division performance
Leverage • Asset based debt • Public debt • 13% Public debt redemption Scheduled repayments of principal • $166m in 2005 • $316m in 2006
Peer company comparisons • Container Division • GNER • Ferries • OEH
Priorities • Improve divisional operating cashflow • Asset sales • Debt reduction • Cost reduction • Rail Division expansion