Download
1 / 48
490 likes | 609 Views
Evolutionary Antecedents of Obesity- Why we are fat. Leslie Sue Lieberman, Ph.D . Director, Women’s Research Center Professor of Anthropology and Medical Education University of Central Florida llieberm@mail.ucf.edu http://womens.research.ucf.edu Learning Institute for Elders

E N D
Evolutionary Antecedents of Obesity- Why we are fat Leslie Sue Lieberman, Ph.D. Director, Women’s Research Center Professor of Anthropology and Medical Education University of Central Florida llieberm@mail.ucf.edu http://womens.research.ucf.edu Learning Institute for Elders August 31, 2010.
Why are we having an obesity ‘pandemic’ now? Is there a mismatch of human biology sculpted by millennia of natural selection and the modern environment? - or- Has the modern environment optimized human biological functions? In modern environments are we naturally selectedto be fat?
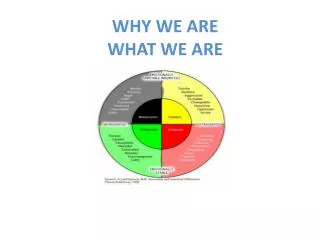
The Eternal TriangleHuman Adaptability Model Culture Biology Environment
Obesity Prevalence • 1.7 billion overweight & obese worldwide • 67% of Americans are overweight or obese • 18.4% of 4 yr olds and 16% of American youth (6–18 yrs) are overweight or obese (≥ 95th % NCHS) • 22 million (3.3%) children worldwide < 5 yrs of age are overwt. World Health Organization 1999, 2000, 2004, 2006, 2007; Early Childhood Longitudinal Study, Birth Cohort; www.cdc.gov.pedness, 2009)
Regional Changes in Obesity Prevalence 2000- 2030 International Obesity Task Force, WHO, 2007
Normal and Obese ob/ob Mice The ob/ob or obese mouse is a mutant mouse that eats excessively and becomes profoundly obese. It is an animal model of type II diabetes. Identification of the gene mutated in ob led to the discovery of the hormoneleptin, which is important in the control of appetite.
Obesity Genes • Following inconsistent replication of candidate gene associations and family-based linkage analyses, genome-wide association studies have replicated in > 65,000 individuals ~17 genetic loci containing variants associated with BMI(e.g., FTO, MC4R, TMEM18) • FTO genotype AA is associated with higher fat mass, lower activity level, greater enjoyment of food and higher satiety threshold than other genotypes • Relatively little variation (~1%), but in aggregate may explain ~ 6 kg difference in adult body weight • Many expressed in hypothalamus, may regulate appetite
Prenatal Epigenetic Effects The mother of the mouse on the left received a normal diet, while the mother of the mouse on the right received a diet supplemented with methyl donors such as choline, betaine, folic acid, and vitamin B12. The mice are genetically identical.(Jurtle, R., Genetic, Engineering & Biotechnology News, 2009)
Epigenetics Hypermethylation leads to silencing genes Hypomethylation leads to gene expression Critical periods for epigenetic modification Early fetal life Germ cell development Others? Thus, the epigenome constitutes the annotation of the genomic variation and results in differences in gene expression unrelated to DNA sequence variation.
Fetal Origins of Thrifty Phenotypes Deleterious intrauterine environment →dysregulation of growth → low infant birth weight and altered energy regulation → high infant birth weight and altered energy regulation
Appetite-Regulatory Hormones, Enzymes and Neuropeptides(Examples) • Some have multiple sources and interact • Adipocytes- (Adipokinins)Enhance: Resistin Suppress: Leptin, Adiponectin,TNF-ą • Stomach/Intestines-Enhance: Orexin, Ghrelin; Suppress: PYY, PPY, CCK, Proglucagon • Pancreas-Enhance and Suppress: Insulin • Hypothalmus-Enhance: NPY, Dopamine Suppress: POMC, CART, Endocanabinoids
Regions of the Brain Containing Von Economo Neurons (VENs) • A lateral view with fronto-insular cortex (FI) in red. • A medial view with anterior cingulate cortex (ACC) in red. • Von Economo and Koskinas (1925) Die Cytoarchitectonik der Hirnrinde • des erwachsenen Menschen, Springer; see articles by John Allman of Caltech
Cephalic Phase of Digestion • Seeing, smelling and anticipating food is perceived by the brain that informs the stomach to prepare for a food. • Parasympathetic stimuli acting through the vagus nerve enteric nervous system to release acetylcholine to stimulate G cells to secrete gastrin and parietal cells to secrete stomach acid Increase in gastric motility
Vision is the Dominant Sense Decreased sense of smell and size of snout Orbital frontality Orbits protected by bone Stereoscopic vision/depth perception Color vision Complex, large brain
Vision and Food-Related Behaviors • Must see food- hunting, foraging, scavenging • Color has appeal and signals taste, texture and nutrients, toxins (e.g., ripened fruits; leaves) • Poor judge of ingested portion sizes based on sensory information • ‘Size’ based on experience, expectations (norms), variety, form, packaging • We are visually distractible- people, TV, reading, driving, etc.
Time-Temperature Color Indicators of Food Freshness
Other Biological Obesogenic Factors • Taste- preference for sweet (and fat); processing produces ‘super-delicious’ foods; umami taste; common optimal taste of fast foods • Sleep - short sleep duration reduces leptin& increases ghrelinand increases BMI • Gut microorganisms-Firmicute bacteria extract sugar from plant carbsand in mice increase obesity & insulin resistance • Adenovirus-36- 50% of infected stems cells became fat cells (Pasarica, 2007) • Restrained eating (dieting) induces psychological stress and stress hormones
Environmental Obesogens • Definition: Obesogens are xenobiotic chemicals that can disrupt adipogensis and homeostatic control over energy metabolism(Grün and Blumberg ,Endocrinology, 2, Vol. 147, 2006) • The model is similar to environmental endocrine disruptors that affect reproduction and health (e.g., prenatal exposure to nicotine alters postnatal weight gain, exposure to pesticides and herbicides have been linked to gestational diabetes mellitus) • Some examples are: fungicides (organotins- tributyltin-TBT), herbicides (atrazine ATZ) and pesticides (diazinon)
Impairment of insulin sensitivity by ATZ exposure in regular diet rats Lim et al. PLoSONE 2009 (4)4:e5186
Induction of obesity in rats by ATZ treatment Lim et al. PLoSONE 2009 (4)4:e5186
Paleolithic Diets • 3000 Kcal/day • High in protein (30% of energy) • High in carbohydrate- unrefined • Low in fats, especially saturated fat (20-25% of energy) • High in dietary fiber (100 g/day)
Abundant Food Choices – The more You See, the More You Eat- The Omnivore's Dilemma
Food Qualities and Serving Characteristics- • Variety (color, taste, shape) • Attractiveness (shape, color, arrangement) • Amount (large serving sizes, stockpiles) • Eating effort (low effort-fingers, forks, bit sizes, shelled nuts, easy-open packaging)
Biobehavioral Risk Factors and Responses in an Obesogenic Environment • Preference for fatty foods increase fat intake • Weak satiation with large portion sizes increase meal size • High hedonic responsiveness increase amount eaten • Weak postingestive satiety increase frequency of eating and eating re-initiation
Supersized Servings • Muffin & Bagel (2-3 servings) • Pot Pie (2 servings) and Cookies (one per serving) • Spaghetti & Pasta (3 ½ cups average restaurant serving size) • Soft Drinks- portion size = 8 oz but most companies say standard is 32 oz (or 1 liter) 4 times the amount
Misjudging Calories in Restaurant FoodsZinczenko, D. Eat This , Not That, 2008
Judging Portion Sizes and Calories- We Can’t • Popcorn- 50% more from large vs. small popcorn, 14-day-old stale popcorn- still ate 31% more • M & M’s- 120 eaten from 1 lb. bag vs. 63 eaten from ½ lb. bag • Ice Cream- 31% more in large bowls vs. small bowls • Soup- continually filled, ate 76% more • Lunch- college students could not tell low vs. high calorie foods
Where We Get Food • Food is available 24 hrs/day every day in the US • On any one day, 40% of US adults are eating in a restaurant or food outlet (e.g., Starbucks) 45 million/day - fast food Little or no energy expended on food acquisition, preparation, service or clean up. • Restaurants, shopping malls, supermarkets, out door markets, kiosks, street vendors, vending machines, work and school cafeterias, theaters, sports events, gas stations, convenience stores, bookstores, coffee shops, airports, hospitals- - -
Number of Selected Fast Food Restaurant Chains and Number of Countries (2008-09)
Foraging Behavioral Ecology and Optimal Environments • Modern environments have: 1. High density ofhigh quality food patches 2. Patches are accessible and well advertised (visual cues) to reduce search/ travel time 3. The rate of diminishing returns is modulated by abundance energy-dense food and human capacity (satiety) 4. Marginal Value Theorem-get as much energy per time (and money) spent; Return on Investment
What Can be Done Now? • Intervene prenatally and infancy-phenotypic programming, enhance intrauterine environment, normal birth weight; Breastfeeding protective? • Develop efficacious drugs-treat obesity as a chronic disease not a failure of hypervigilence • Legislate/regulate the food supply-food labels, outlaw transfats, reduce use of corn syrup, provide healthy choices in vending machines • Choice Architecture-Making good choices easy, rewarding, normative (Nudge: Improving Health, Wealth and Happiness, R. Thaler & C. Sunstein, Yale U. Press, 2008)
Choice Architecture • School Cafeteria Line- item placement ld accounted for 25% difference in consumption of specific foods (Thaler, RH & Sunstein, CR Nudge: Improving Decisions about Health, Wealth & Happiness, Yale U. Press, 2008) • Reduce cognitive effort for a ‘good choice’ (e.g.,carrots at eye level) and increase effort or cost for a ‘bad’ choice” (e.g., candy)
Children’s Exposure to TV Food Ads • 2006 Children’s Food and Beverage Advertising Initiative, 50% of all advertising to healthier foods or messages on fitness or nutrition • Average annual number of food ads and nutrition PSA’s 2-7 yr olds 4,427 and 164 8-12 yr olds 7,609 and 158 13- 17 yr olds 6,098 and 47 Television Food Advertising to Children in the United States A Kaiser Family Foundation Report Gantz W. , et al 2007
Distribution of Advertising Exposure by Food Products Among Adolescents Ages 12 to 17 S. Weiss, RWJF Research Highlight, Adolescent Exposure to Food Advertising on Television, Number 34, Sept 2007.
Mirroring Consumption Behaviors • People consume more food when they are with other people in a positive linear relationship 35% more with one person, 75% more with 4 people and 96% more with 7 or more people (Winsink B, Mindless Eating: Why We Eat More than WE Think, 2006) • People more closely mimic the weight gain of friends than family or neighbors . An obese close friend increases one’s risk of obesity by 171% based on the longitudinal Framingham study. (Christakis, N. et al, New England J of Medicine, 2006)
Can we slow the growing obesity pandemic ? ……. Probably not ……. We are the product of human evolution that flouishes in an obesogenic environment and
The Sun Never Sets on McDonalds Thank you
Fat-Proofing Your Home • Use smaller plates ,cups, bowls, and and spoons & forks • Use glasses that are tall and narrow • Serve plates of food- not family style • Leave the food in the kitchen not on the table • If it is on the table, cover the food-out-of-sight
Fat-Proofing Your Home • If you eat while watching TV or reading, take small portions • If you buy bulk food, divide it into smaller portions and make it difficult to get at it (ex. back of the pantry, freeze it) • Keep food out-of-sight • Remember, people will follow your lead, you set the eating norms
Fat-Proofing Meals Out • Do not frequent buffet-style restaurants • Do not order fatty appetizers (ex., fried onion rings, cheese dips, loaded nacho chips) order veggies or protein (ex., veggies & dip, chicken wings, fish) and share with others • Share an entrée and/or dessert • Order low calorie or no calorie drinks and watch out for refills • Take home a doggie bag