Download
1 / 27
330 likes | 808 Views
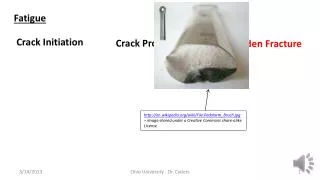
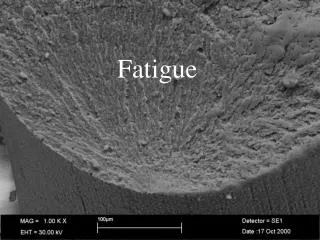
Fatigue Mechanism. crack origin. • Crack grows incrementally. typ. 1 to 6. increase in crack length per loading cycle. • Failed rotating shaft --crack grew even though K max < K c --crack grows faster as • Ds increases • crack gets longer

E N D
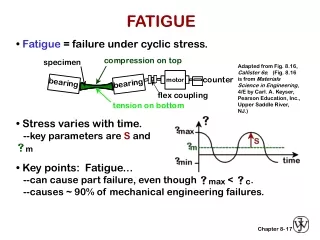
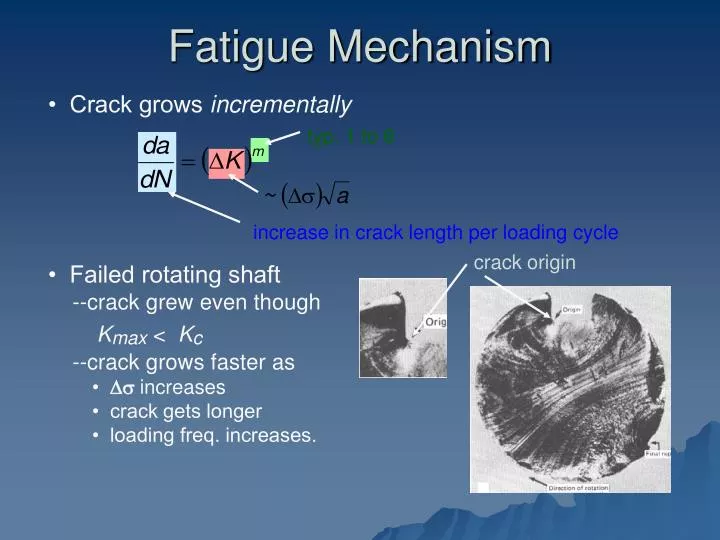
Fatigue Mechanism crack origin • Crack grows incrementally typ. 1 to 6 increase in crack length per loading cycle • Failed rotating shaft --crack grew even though Kmax < Kc --crack grows faster as • Ds increases • crack gets longer • loading freq. increases.
Fatigue Design Parameters S = stress amplitude case for unsafe steel (typ.) Sfat safe 3 5 7 9 10 10 10 10 N = Cycles to failure • Sometimes, the fatigue limit is zero! S = stress amplitude case for Al (typ.) unsafe safe Adapted from Fig. 8.19(b), Callister 7e. 3 5 7 9 10 10 10 10 N = Cycles to failure • Fatigue limit, Sfat: --no fatigue if S < Sfat Adapted from Fig. 8.19(a), Callister 7e.
S = stress amplitude Increasingm s near zero or compressive m s moderate tensile m s Larger tensile m N = Cycles to failure --Method 1: shot peening --Method 2: carburizing shot C-rich gas put surface into compression 2. Remove stress concentrators. better bad Adapted from Fig. 8.25, Callister 7e. bad better Improving Fatigue Life 1. Impose a compressive surface stress (to suppress surface cracks from growing) Adapted from Fig. 8.24, Callister 7e.
THE COST OF CORROSION • Corrosion: -- the destructive electrochemical attack of a material. -- Al Capone's ship, Sapona, off the coast of Bimini. Photos courtesy L.M. Maestas, Sandia National Labs. Used with permission. • Cost: -- 4 to 5% of the Gross National Product (GNP)* -- this amounts to just over $400 billion/yr** * H.H. Uhlig and W.R. Revie, Corrosion and Corrosion Control: An Introduction to Corrosion Science and Engineering, 3rd ed., John Wiley and Sons, Inc., 1985. **Economic Report of the President (1998).
What is CORROSION? Corrosion is a natural event It represents a return of metals to their more natural state as minerals (oxides)
ORE METAL Metal “Wants” to be Dirt ENERGY
Basics of Corrosion Corrosion is essentially the oxidation of metal Source: Moore, J.J. Chemical Metallurgy • Need: • An Anode (where oxidation is taking place) • A Cathode (where reduction is taking place) • Conductive electrolyte • Electrical contact between the Anode and Cathode
Electrochemistry • Corrosion is an electrochemical reaction • ½ reaction at the anode: M Mn+ + ne- • Possible ½ reactions at the cathode: 2H+ + 2e- H2 Acid Solutions: H2O + e- ½ H2 + OH- ½ O2 + 2H+ + 2e- 2OH- • Important thing to note is the flow of electrons
Thermodynamic Driving Force • Like all chemical reactions – Thermodynamics • What is the driving force for the reaction? (otherwise stated as what is the electrochemical potential for the reaction) • Dissimilar metals • Different cold work states • Different grain sizes • Difference in local chemistry • Difference in the availability of species for a reaction (concentration cells) • Differential aeration cells
Derivation of Nernst Equation For: 1 1
Derivation of Nernst Equation… • Introduce: The total electropotential is • DG = -nFE Where: F = Faraday’s constant (total charge on Avogadro’s number of electrons) n = the number of electrons transferred E = The electrode potential
Thermodynamics Continued Nernst Equation: THE Basic equation which describes ALL corrosion reactions For Our Example: Note: pH = -log10[H+]
Pourbaix Diagram • Potential vs pH • pH is the measure of [H+] ions in solution • Map regions of thermodynamic stability for metal’s aqueous chemical species Source: www.corrosionsource.com
• Metal with smaller Vometal corrodes. • Ex: Cd-Ni cell - + o DV = 0.153V Cd Ni 25°C 1.0 M 1.0 M 2 + 2+ Cd solution Ni solution STANDARD EMF SERIES • EMF series o V metal metal Au Cu Pb Sn Ni Co Cd Fe Cr Zn Al Mg Na K +1.420 V +0.340 - 0.126 - 0.136 - 0.250 - 0.277 - 0.403 - 0.440 - 0.744 - 0.763 - 1.662 - 2.363 - 2.714 - 2.924 more cathodic more anodic
Galvanic SeriesHUNTINGTON CITY WATER, 25C Volts: Saturated Calomel Half-Cell Reference Electrode -1.2 -1.1 -1.6 -1.3 -1.4 -1.5 -1.7 -1.8 0 -1.0 -0.1 -0.2 -0.3 -0.4 -0.6 -0.7 -0.5 -0.9 -0.8 +0.3 +0.4 +0.2 +0.1 Magnesium Manganese Cast Iron Zinc Aluminum Aluminum Alloy 5052 Mild Steel Tin Lead Nickel - Silver Copper Alloy 20Cb3 Alloy 18-18-2 Brass Alloys Alloy 3RE60 70 - 30 Copper-Nickel 90 - 10 Copper-Nickel Alloy EFE62 Bronze Alloys Alloy 6X Alloy 17-4PH Alloy 255 (ferrallium) Alloy 230 (Coronel) Alloy 26-1, 26-1 - 1/4 Alloys C276, G, X Alloy 254 SLX MONEL alloys 400, R405, K500 Alloy B, P, PD (Illium) INCOLOY alloy 800, 825, 840 Nickel 200, 270 Stainless Steel 304, 316, 317, 403 INCONEL alloys 600, 617, 618, 625, 671, 690, 702, X750 Titanium Alloy 700 (Jessop) +0.64 - 0.76V Platinum Source: Crum and Scarberry, Corrosion of Nickel Base Alloys Conference Proceedings - ASM 1985
H 2H+ +2e- 0.1 for H2 io ANODIC 2 0 E on Fe A 0.0 A 2H+ +2e- H2 -0.1 CATHODIC E -0.2 CORR POTENTIAL VOLTS (SHE) -0.3 Fe Fe+2 +2e- ANODIC 0 io Fe E -0.4 B B i CORR -0.5 Fe+2 +2e- Fe CATHODIC -0.6 -0.7 -10 -9 -8 -7 -6 -5 -4 -3 -2 10 10 10 10 10 10 10 10 10 CURRENT DENSITY, A/cm² Kinetics Describes Rate of ReactionEvan’s Diagram
Aa = Area Inside Crevice (Anodic) Ac = Area Outside Crevice (Cathodic) Aa << Ac M M+ +e- Aa A io i c + o H+ H Aa io E O2 Ac ia E O2 O2 /OH + ½ O2 + H2O + 2e- 2OH- E M/M+ icorrin very aggresive environment Crevice Effect No Crevice PLUS Crevice Effect Effect Log i Area Effects
Increasing Oxidant Concentration M M+ Log i [Fontanna and Greene, Corrosion Engineering, McGraw-Hill, 1967] Effect of Oxidizer Concentration (e.g., Oxygen) on the Electrochemical Behavior of an Active - Passive Metal
35 30 25 20 CORROSION RATE (MPY)) 15 10 5 0 2 3 4 5 6 7 0 1 8 9 10 11 DISSOLVED O2 (PPM) 0 0.7 1.4 2.1 2.8 3.5 4.2 4.9 5.6 6.3 7.0 7.7 DISSOLVED O2 (Mg / H2O) LEGEND FRESH WATER @ 50°F FRESH WATER @ 90°F FRESH WATER @ 120°F VELOCITY = 2.5 FPS pH=7, R=100M-0HM pH=7, R=2500M-0HM Effect of Temperature and Dissolved O2
Types of Aqueous Corrosion Cells • General Corrosion • Localized Corrosion • Pitting • Crevice Corrosion • Under-deposit Corrosion • MIC • Tuberculation • Galvanic Corrosion
O - e O M+ - e - e M+ - e O O - OH - - e OH M+ - e - e M+ - e O O - e M+ General Corrosion • Random Creation and Destruction of Anodes and Cathodes • Movement of Anodes and Cathodes • Near Uniform Thinning • Weight Loss is a Useful Measure Source: Corrosion, ASM Handbook, Volume 13, 1987
General Corrosion Original Surface Penetration due to Corrosion
M(OH)n M(OH)n OH- OH- CI- Mn+ e e- Localized Corrosion • Stationary Electrodes • All of the dissolution occurs in one location • Weight loss measurement – not useful • Local Penetration • Sometimes local weakening • May or may not jeopardize structural integrity • Determines “failure” Source: Corrosion, ASM Handbook, Volume 13,1987
Potential + Anodic Current Density Cathodic - Localized Anodic Site Metal Potential and Current Fields in Electrolyte in the Vicinity of a Localized Corrosion Site