Download
1 / 1
100 likes | 400 Views
Department of Forest Environment and Resources Dipartimento di Scienze dell ’ Ambiente Forestale e delle sue Risorse. 2. a. 1. b. a. b. c. Ankasa flux tower. Other eddy covariance sites of the Carboafrica network. University of Cape Coast. University of Tuscia.

E N D
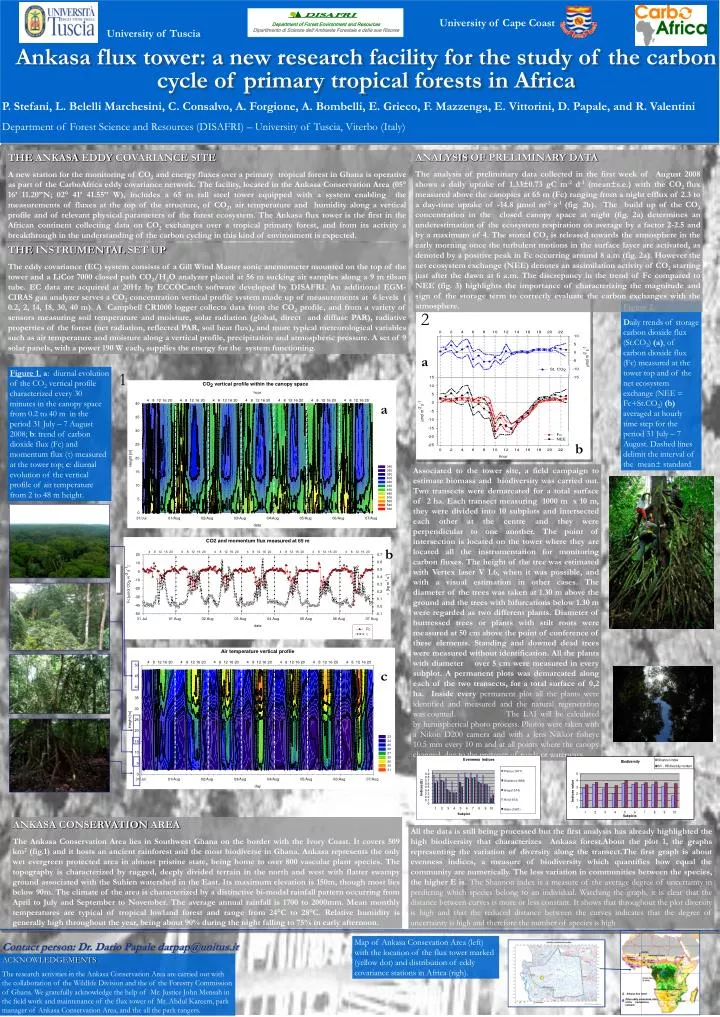
DepartmentofForestEnvironment and Resources Dipartimento di Scienze dell’Ambiente Forestale e delle sue Risorse 2 a 1 b a b c Ankasa flux tower Other eddy covariance sites of the Carboafrica network University of Cape Coast University of Tuscia Ankasa flux tower: a new research facility for the study of the carbon cycle of primary tropical forests in Africa P. Stefani, L. Belelli Marchesini, C. Consalvo, A. Forgione, A. Bombelli, E. Grieco, F. Mazzenga, E. Vittorini, D. Papale, and R. Valentini Department of Forest Science and Resources (DISAFRI) – University of Tuscia, Viterbo (Italy) ANALYSIS OF PRELIMINARY DATA The analysis of preliminary data collected in the first week of August 2008 shows a daily uptake of 1.33±0.73 gC m-2 d-1 (mean±s.e.) with the CO2 flux measured above the canopies at 65 m (Fc) ranging from a night efflux of 2.3 to a day-time uptake of -14.8 mmol m-2 s-1 (fig. 2b). The build up of the CO2 concentration in the closed canopy space at night (fig. 2a) determines an underestimation of the ecosystem respiration on average by a factor 2-2.5 and by a maximum of 4. The stored CO2 is released towards the atmosphere in the early morning once the turbulent motions in the surface layer are activated, as denoted by a positive peak in Fc occurring around 8 a.m (fig. 2a). However the net ecosystem exchange (NEE) denotes an assimilation activity of CO2 starting just after the dawn at 6 a.m. The discrepancy in the trend of Fc compared to NEE (fig. 3) highlights the importance of characterizing the magnitude and sign of the storage term to correctly evaluate the carbon exchanges with the atmosphere. THE ANKASA EDDY COVARIANCE SITE A new station for the monitoring of CO2 and energy fluxes over a primary tropical forest in Ghana is operative as part of the CarboAfrica eddy covariance network. The facility, located in the Ankasa Conservation Area (05° 16’ 11.20’’N; 02° 41’ 41.55’’ W), includes a 65 m tall steel tower equipped with a system enabling the measurements of fluxes at the top of the structure, of CO2, air temperature and humidity along a vertical profile and of relevant physical parameters of the forest ecosystem. The Ankasa flux tower is the first in the African continent collecting data on CO2 exchanges over a tropical primary forest, and from its activity a breakthrough in the understanding of the carbon cycling in this kind of environment is expected. THE INSTRUMENTAL SET UP The eddy covariance (EC) system consists of a Gill Wind Master sonic anemometer mounted on the top of the tower and a LiCor 7000 closed path CO2/H2O analyzer placed at 56 m sucking air samples along a 9 m rilsan tube. EC data are acquired at 20Hz by ECCOCatch software developed by DISAFRI. An additional EGM-CIRAS gas analyzer serves a CO2 concentration vertical profile system made up of measurements at 6 levels ( 0.2, 2, 14, 18, 30, 40 m). A Campbell CR1000 logger collects data from the CO2 profile, and from a variety of sensors measuring soil temperature and moisture, solar radiation (global, direct and diffuse PAR), radiative properties of the forest (net radiation, reflected PAR, soil heat flux), and more typical meteorological variables such as air temperature and moisture along a vertical profile, precipitation and atmospheric pressure. A set of 9 solar panels, with a power 190 W each, supplies the energy for the system functioning. Figure 2. Daily trends of storage carbon dioxide flux (St.CO2) (a), of carbon dioxide flux (Fc) measured at the tower top and of the net ecosystem exchange (NEE = Fc+St.CO2) (b) averaged at hourly time step for the period 31 July – 7 August. Dashed lines delimit the interval of the mean± standard error. Figure 1.a: diurnal evolution of the CO2 vertical profile characterized every 30 minutes in the canopy space from 0.2 to 40 m in the period 31 July – 7 August 2008; b: trend of carbon dioxide flux (Fc) and momentum flux (τ) measured at the tower top; c: diurnal evolution of the vertical profile of air temperature from 2 to 48 m height. Associated to the tower site, a field campaign to estimate biomass and biodiversity was carried out. Two transects were demarcated for a total surface of 2 ha. Each transect measuring 1000 m x 10 m, they were divided into 10 subplots and intersected each other at the centre and they were perpendicular to one another. The point of intersection is located on the tower where they are located all the instrumentation for monitoring carbon fluxes.The height of the tree was estimated with Vertex laser V 1.6, when it was possible, and with a visual estimation in other cases. The diameter of the trees was taken at 1.30 m above the ground and the trees with bifurcations below 1.30 m were regarded as two different plants. Diameter of buttressed trees or plants with stilt roots were measured at 50 cm above the point of conference of these elements. Standing and downed dead trees were measured without identification. All the plants with diameter over 5 cm were measured in every subplot. A permanent plots was demarcated along each of the two transects, for a total surface of 0,2 ha. Inside every permanent plot all the plants were identified and measured and the natural regeneration was counted. The LAI will be calculated by hemispherical photo process. Photos were taken with a Nikon D200 camera and with a lens Nikkor fisheye 10.5 mm every 10 m and at allpointswhere the canopychanged due to the presenceofroads or waterways. ANKASA CONSERVATION AREA The Ankasa Conservation Area lies in Southwest Ghana on the border with the Ivory Coast. It covers 509 km2 (fig.1) and it hosts an ancient rainforest and the most biodiverse in Ghana. Ankasa represents the only wet evergreen protected area in almost pristine state, being home to over 800 vascular plant species. The topography is characterized by rugged, deeply divided terrain in the north and west with flatter swampy ground associated with the Suhien watershed in the East. Its maximum elevation is 150m, though most lies below 90m. The climate of the area is characterized by a distinctive bi-modal rainfall pattern occurring from April to July and September to November. The average annual rainfall is 1700 to 2000mm. Mean monthly temperatures are typical of tropical lowland forest and range from 24°C to 28°C. Relative humidity is generally high throughout the year, being about 90% during the night falling to 75% in early afternoon. All the data isstillbeingprocessedbut the first analysishasalready highlighted the high biodiversity that characterizes Ankasa forest.About the plot 1, the graphs representing the variation of diversity along the transect.The first graph is about evenness indices, a measureofbiodiversitywhichquantifieshowequal the community are numerically. The lessvariation in communitiesbetween the species, the higher E is. The Shannon index is a measure of the average degree of uncertainty in predicting which species belong to an individual. Watching the graph, it is clear that the distance between curves is more or less constant. It shows that throughout the plot diversity is high and that the reduced distance between the curves indicates that the degree of uncertainty is high and therefore the number of species is high Map of Ankasa Consevation Area (left) with the location of the flux tower marked (yellow dot) and distribution of eddy covariance stations in Africa (righ). Contactperson: Dr. Dario Papale darpap@unitus.it ACKNOWLEDGEMENTS The research activities in the Ankasa Conservation Area are carried out with the collaboration of the Wildlife Division and the of the Forestry Commission of Ghana. We gratefully acknowledge the help of Mr. Justice John Mensah in the field work and maintenance of the flux tower of Mr. Abdul Kareem, park manager of Ankasa Conservation Area, and the all the park rangers.