Download
1 / 48
680 likes | 1.3k Views
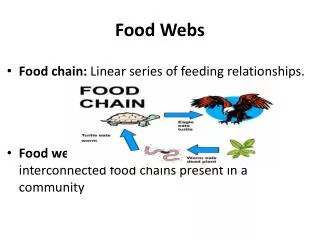
Food webs and trophic cascades in lakes. How to represent trophic relationships? (Paine 1980). Connectedness Based on observations Energy flow web Based on literature and measurements Functional web based on controlled manipulations. 1. Connectedness food web.

E N D
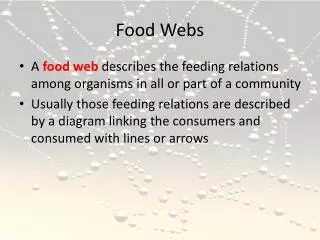
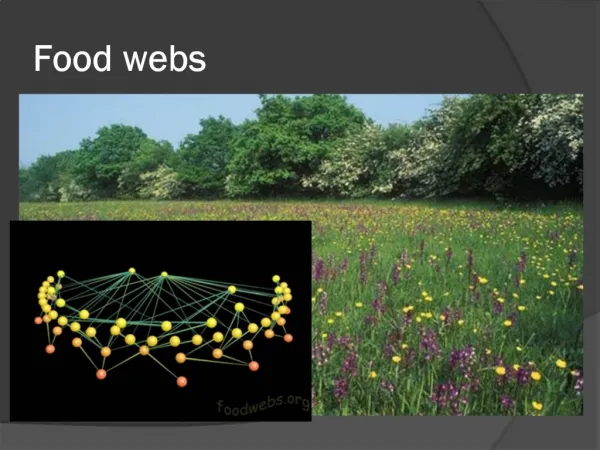
How to represent trophic relationships? (Paine 1980) • Connectedness Based on observations • Energy flow web Based on literature and measurements • Functional web based on controlled manipulations
1. Connectedness food web • Depicts observed feeding links between organisms. • Indicates ‘structure’ of system.
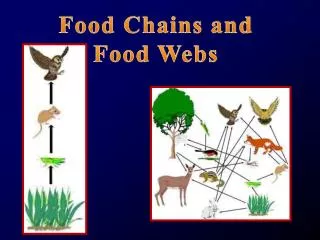
Food web of the North Atlantic • Simple food chain
Another food web of the North Atlantic • Complex food web
2. Energy flow food web • Trophic level – number of energy transfers between primary producers and consumer (trout). • Assumes discrete food chain, simple trophic structure
Energy flow • Trophic level concept useful for predicting contaminant levels • Bioaccumulation: the accumulation of substances that are not excreted and are subsequently passed from prey to predator 3 4 5 Estimated # of trophic levels
Energy flow: more complex pathways Use diet information to describe energy flow pathways Trophic position – trophic height of species. Considers diet and energy flow pathways. Species can fall between trophic levels. Omnivory – feeding on more than one trophic level
3. Functional food web • Depicts dynamically important interactions • Impact of predators on prey populations
Summary • Many different ways to view food webs. • Basis for food web ecology and and ecosystem ecology. • Ecosystem management and many applied problems (contaminants, fisheries management) require understanding of complex species interrelationships. • Species do not exist in isolation – all linked through the food web and predator/prey relationships
Trophic Cascade Hypothesis • Nutrient supply limits algae biomass (chl-a) and production • Nutrients explain only some of the variability in algal biomass Does food web structure explain remaining variation in algae biomass and production??? Concern with functional web: Impact of predators on prey
Trophic Cascade Hypothesis Piscivore biomass in relation to biomass (solid line) and production (dashed line) of vertebrate zooplanktivores, large herbivores, and phytoplankton.
(Top-down) trophic cascades • Nutrients and predation explain variation in primary production • Trophic levels are alternately limited by resources and predation
Conditions for Trophic Cascades 1. Consumers can control biomass of prey
If Cpredator > Pprey Prey controlled by predator If Cpredator < Pprey Prey not controlled by predator P = production C = consumption Bioenergetic budget G=growth (~ production) C=consumption R=respiration F=feces E=excreta Conditions for Trophic Cascades
Conditions for Trophic Cascades 2. Simple and well-known food web
Conditions for Trophic Cascades 3. Size-selective predation alewife From Brooks and Dodson 1965
Experimental tests of trophic cascades • Stream food webs • Small lake • Lake Mendota
Trophic cascades in California streams Algae Invertebrate grazers Invertebrate predators Fish Number of trophic levels (3 or 4) determines abundance of predators, grazers, and algae!
Trophic Cascade Hypothesis: Peter and Paul Lake, MI Planktivore lake Piscivore lake Peter and Paul Lake, MI
Food web biomanipulation of Lake Mendota (1976-2001): Stocking piscivores to improve fishing and water clarity • Algal blooms a major problem • Piscivore populations were low • Biomanipulation had reduced algal levels in other lakes (Peter and Paul) • Lots of long-term data • Partnership between DNR and UW Madison
Food web of intermediate complexity Simplification of reality Captures major species and interactions Lumps species into trophic groups Lake Mendota pelagic food web
Piscivore stocking 1987-1999: • 2.7 million walleye • 170,000 northern pike From Lathrop et al. in press
Walleye fingerlings (1 + year old hatchery-raised)
Harvest regulations • Size limits • Daily bag limit changed 5 to 1 for pike 5 to 3 for walleye From Lathrop et al. in press
Total consumption estimated using bioenergetic model From Lathrop et al. in press
Zooplankton response Small-bodied Daphnia galeata mendotae Large-bodied Daphnia pulicaria From Lathrop et al. in press
Impact on water clarity?? Dotted = large-bodied zooplankton Solid = small-bodied zooplankton Impact on water clarity?? From Lathrop et al. in press
Major cisco die-off 1 year before stocking began From Lathrop et al. in press
From Lathrop et al. in press Must consider nutrient loading as well!
Biomanipulation of Lake Mendota: Summary • Success: Daphnia pulicaria have dominated for over a decade • Changes in fisheries management affected water quality. Links fields of limnology and fisheries. • Management considered the human dimension in an ecosystem context • Managers learned how food webs can be manipulated to improve water quality
Importance of reducing nutrient loading Nutrients set the potential algal biomass, food web structure can affect realized biomass Biomanipulation of Lake Mendota: Summary Planktivore systems Piscivore systems
Energy flow • Energy and nutrients are transferred up the food chain • Bioenergetic approach – calculate energetic budget for organism or population • I= ingestion • NU= lost through feces • A= assimilation • R= respiration • G= growth • B= biomass B
Energy flow • Link up bioenergetic budgets for multiple trophic levels Trophic level 1 Trophic level 2 Trophic level 3
Trophic cascade Algae Invertebrate grazers Invertebrate predators Fish • Stream food webs in California
Food web of Lake Mendota • Intermediate complexity • Simplification of reality • Capture the most species and interactions • Lump species into trophic groups
What about benthic-pelagic linkages? • Is the benthic food chain linked to the pelagic food chain? ?????
Benthic-pelagic linkages • Fish get much of their energy from benthic food chains
Importance of benthic food webs • Reliance on benthic food chains varies among lakes • Decreases with lake area