Download
1 / 61
610 likes | 686 Views
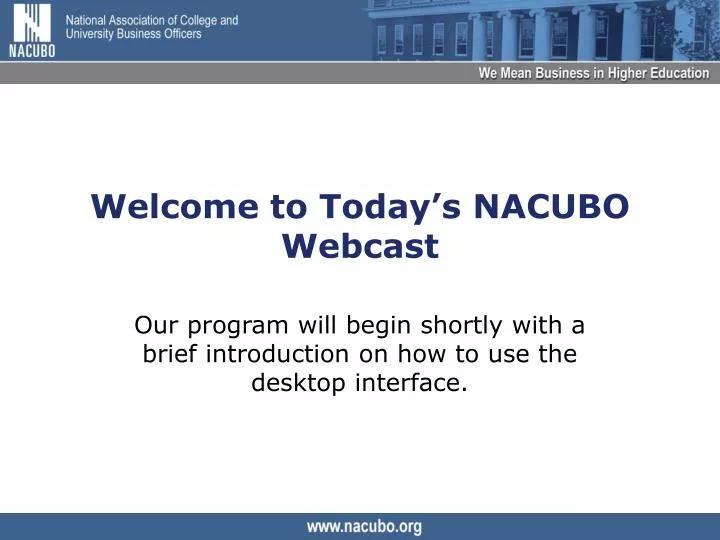
Welcome to Today’s NACUBO Webcast. Our program will begin shortly with a brief introduction on how to use the desktop interface. Element Toolbar. Media Player. Element Display. Quick Question. Primary Toolbar. Desktop Interface. CPE Credit You must complete surveys to receive CPE credit.

E N D
Welcome to Today’s NACUBO Webcast Our program will begin shortly with a brief introduction on how to use the desktop interface.
Element Toolbar Media Player Element Display Quick Question Primary Toolbar Desktop Interface
CPE CreditYou must complete surveys to receive CPE credit ResourcePage Click directly in the element area to answer survey questions
How to Ask Questions • Select “Expert” from the dropdown menu • Type your question • Click on Submit The Online Experts InBox button will illuminate when you receive a response. To view the answer to your question, click on this button and then select “Answered Questions.”
Sync Review Preview Enlarge Reviewing Elements • To review elements, use the Review and Preview buttons in the Element toolbar. • Click on the Sync button to rejoin the presenter. NOTE: This button appears “unplugged” if you are not synchronized with the presenter.
Buffering • If you experience sustained periods of buffering, click on the Speed button and select a lower stream rate. • Contact the helpdesk at 1-800-462-4916. Speed Button
Managing the Faculty of the Future:Retiree Health Insurance TIAA-CREF Institute, NACUBO and ACE November 10, 2004
INTRODUCTION:Health Insurance in Higher Education Dr. Robert Clark Professor, North Carolina State University TIAA-CREF Institute Director of Research
Challenges Facing Higher Education • Budgetary Shortfalls • Aging Faculties • Rising cost of health and retirement benefits
Budgetary Shortfalls • Declines in state appropriations • Declines in endowment earnings • Affect of economy on giving
Causes of Faculty Aging • Slow growth in faculty size • Low turnover rates • Low retirement rates
Health Insurance • Virtually all faculty have health insurance • Many institutions provide retiree health insurance • But costs of health insurance are soaring
Health Insurance • Rapidly rising health care costs are placing financial pressure on colleges • Faculty pay more but still institutional costs are rising
National Health Care Issues • The cost of health insurance is influenced by national trends • Medicare is important to faculty as a benefit, and as a cost
National Health Care Issues • Cost of employer provided health insurance rising by over 10 percent per year • Projections of the cost of Medicare are so large that they are not sustainable
Health Insurance • Private sector firms are quickly dropping and scaling back RHI • Many organizations are finding the costs unsustainable • Need for policy changes and the development of RHI savings accounts
Today’s Program • Describes the national health insurance environment • Examines the future of Medicare • Highlights changes in RHI among non-educational employers • Presents evidence on health insurance trends at universities
Today’s Program We begin with presentations by two nationally prominent experts on health insurance • Dr. Marilyn Moon • Dr. Sylvester Schieber
Today’s Program • Presentations will be followed by short replies then, by taking your questions.
Polling Question #1 • Does your institution provide retirees with health insurance benefits? • Yes, past and present retirees • Yes, but only for prior retirees • No, retiree health insurance is not provided • Unsure
SECTION ONE:An Overview of Healthcare Costs and Medicare Trends Marilyn Moon, Ph.D. Vice President and Program Director American Institutes for Research
A Brief Overview of Medicare • Has changed over time • Reliance on many kinds of supplemental coverage • Rising costs • Compares well with private insurance growth • Higher burdens on beneficiaries over time
Medicare Expenditures by Type of Service: 1966 and 2003 • 2003: 46% Part A; 41% Part B; 13% Part C (Medicare+Choice) • 1967: 70% Part A; 30% Part B Source: Health Care Financing Administration, 2000 and MedPac 2004
Sources of Supplemental CoverageAmong Noninstitutionalized Medicare Beneficiaries,2001 Source: MedPac analysis of Medicare Current Beneficiary Survey, Cost and Use file, 2001
Out-of-Pocket Spending as a Share of Income Among Elderly Beneficiaries Source: Urban Institute Calculations Using NHE, CPI, CPS, and Trustees Report, MCBS
Cumulative Growth Rates Source: Boccuti and Moon 2003; Based on Marilyn Moon’s calculations
Relative Health Status of HMO Enrollees, 1998 Non-HMO Enrollees HMO Enrollees 89.9% No ADLs 85.2% 4.6% 3 or More ADL Limitations 8.2% 78% Health Excellent, Very Good, or Good 68.9% 22% Health Fair or Poor 31.1% Source: HCFA/Office of Strategic Planning: Data from MCBS, 1998
New Drug Legislation • Not help by as much as many think • The donut hole
Beneficiary & Government Share of Spending in 2006, at Individual Expenditure Levels, Under the New Medicare Drug Benefit Source: Boccuti and Moon 2003; Based on Marilyn Moon’s calculations
The Future • Demographics • Higher costs of care per capita • Unsustainable?
Growth in Medicare Spending as a Share of GDP and in Beneficiaries as a Share of Total Population
Affordability From 2003 to 2040 • Increase in GDP per worker - 63% • Increase in GDP per worker if take out Medicare burden - 55% • To do this requires tax increase
Hold Line on Spending? • No tax increase approach 42% cut • Growth proportional to income 33% cut
SECTION TWO:The Future of Retiree Health Benefits in Higher Education in the United States Sylvester J. Schieber, Ph.D. Vice President Watson Wyatt Worldwide
Overview • Background • Context for considering employer-sponsorship of retiree health benefits • Health benefits for retired faculty from institutions of higher education • Conclusions
Personal Health Care Expenditure Patterns, 1960 through 2002 Percentage of expenditures from out-of-pocket Personal health expenditures as percentage of GDP Source: Office of the Actuary, Centers for Medicare & Medicaid Services, U.S. Department of Health and Human Services.
Total Health Care Expenditure Patterns, 1960 through 2002 Source: Office of the Actuary, Centers for Medicare & Medicaid Services, U.S. Department of Health and Human Services.
The Private Sector Story • Retiree health benefits were not carefully thought out • During the 1970s and 1980s, inflation soared • During the 1980s accounting standards raised awareness of the costs • Also during the 1980s tax laws effectively precluded funding
The Private Sector Story, Cont’d • From 1980 to 1997—medium and large firms offering benefits dropped from 80 to 40 % • In 1984, 90 % of plans required 5 years or service or less–by 2001 85 % required 10 years or more • About 30 % of current retirees have service related premiums—for future retirees it is 65 to 70 % • About one-quarter of current retirees face premium caps, 40 % of those close to retirement do & nearly 50 % of new hires do
Polling Question #2 • Has your university increased the share of retiree health care costs paid by faculty or are you considering it? • Yes, already increased the share • Yes, we’re considering it • No, not considering at this time • Unsure
Why Should Employers Care About Health Care Benefits Costs? Source: Bureau of Economic Analysis, U.S. Department of Commerce, National Income and Product Accounts.
Increases in Employers’ Health Benefit Costs & Wages for Recent Years Health cost Wage Year increases increases Difference 2001 10.9 % 4.1 % 6.8 % 2002 12.9 3.2 9.7 2003 13.9 3.1 10.8 2004 11.2 2.3 8.9 Source: The Kaiser Foundation and Health Research and Educational Trust, Employer Health Benefits 2004 Annual Survey.
Employer Contributions to Private Health Benefit Plans as a Percent of Wages (Assuming Wages Grow 4 % a Year) Projection assumes health plan cost growth exceeds wage growth by 6 or 10 percent per year.
Rough Characterization of Health Care Utilization Under Typical Employer Plan ~ 25 % of covered lives < 1 % of covered lives ~ 75 % of covered lives Occasional use of health care services Catastrophic use of health- care services Chronic users of health-care services ~ 15 % of plan costs ~ 60 % of plan costs ~ 25 % of plan costs
Issues Facing Colleges and Universities Different than Those for Private Employers • Accounting issues • FASB does not have domain on public entities • GASB adopted rules for recognizing costs and obligations to take effect for periods after December 15, 2006 • Funding issues • Tax limitations on for-profit sector do not apply • Still there has been little funding • Benefit security issues • Implications of failure to recognize costs • Assuring benefits that are not funded
Private Schools in Survey Providing Retiree Health Benefits to Retired Faculty Current Eligible New retirees to retire hires Pre-65 coverage Retiree 34 34 27 Spouse 34 34 27 Post-65 coverage Retiree 30 29 21 Spouse 30 29 21 Source: Watson Wyatt Worldwide.