Download
1 / 1
10 likes | 60 Views
Abstract Ref. № 1452414 Paper № NH21B-1593. Z . Popova * , М. Ivanova*, K . Doneva * , M. Kercheva *, L . S . Pereira**, V . Alexandrov***, P . Alexandrova *.

E N D
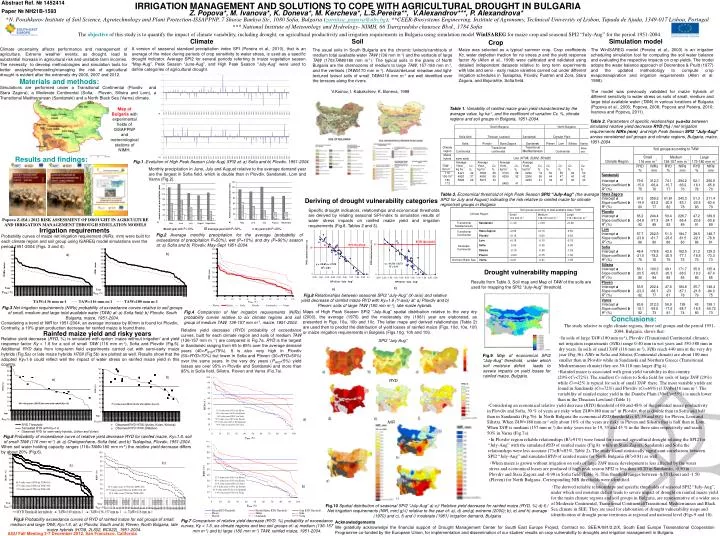
Abstract Ref. № 1452414 Paper № NH21B-1593 Z.Popova*, М. Ivanova*, K. Doneva*, M. Kercheva*,L.S.Pereira**, V.Alexandrov***, P. Alexandrova* *N. Poushkarov Institute of Soil Science, Agrotechnology and Plant Protection-ISSAPPNP, 7 Shosse Bankya Str., 1080 Sofia, Bulgaria(zornitsa_popova@abv.bg);**CEER-Biosystems Engineering, Institute of Agronomy, Technical University of Lisbon, Tapada de Ajuda, 1349-017 Lisboa, Portugal *** National Institute of Meteorology and Hydrology-NIMH, 66 Tsarigradsko chaussee Blvd., 1784 Sofia The objective of this study is to quantify the impact of climate variability, including drought, on agricultural productivity and irrigation requirements in Bulgaria using simulation model WinISAREG for maize crop and seasonal SPI2 “July-Aug” for the period 1951-2004. IRRIGATION MANAGEMENT AND SOLUTIONS TO COPE WITH AGRICULTURAL DROUGHT IN BULGARIA Climate Soil Simulation model Crop Maize was selected as a typical summer crop. Crop coefficients Kc, water depletion fraction for no stress p and the yield response factor Ky (Allen et al., 1998) were calibrated and validated using detailed independent datasets relative to long term experiments with late and semi - early maize varieties carried out under different irrigation schedules in Tsalapitsa, Plovdiv, Pustren and Zora, Stara Zagora, and Bojurishte, Sofia field. A version of seasonal standard precipitation index SPI (Pereira et al., 2010), that is an average of the index during periods of crop sensitivity to water stress, is used as a specific drought indicator. Average SPI2 for several periods referring to maize vegetation season “May-Aug”, Peak Season “June-Aug”, and High Peak Season “July-Aug” were used to define categories of agricultural drought. Climate uncertainty affects performance and management of agriculture.Extreme weather events, as drought, lead to substantial increase in agricultural risk and unstable farm incomes. The necessity to develop methodologies and simulation tools for better analysing/forecasting/managing the risk of agricultural drought is evident after the extremely dry 2000, 2007 and 2012. The WinISAREG model (Pereira et al., 2003) is an irrigation scheduling simulation tool for computing the soil water balance and evaluating the respective impacts on crop yields. The model adopts the water balance approach of Doorenbos & Pruitt (1977) and the updated methodology to compute crop evapotranspiration and irrigation requirements (Allen et al. 1998). The usual soils in South Bulgaria are the chromic luvisols/cambisols of medium total available water TAW (136 mm m-1) and the vertisols of large TAW (170≤TAW≤180 mm m-1). The typical soils in the plains of North Bulgaria are the chernozems of medium to large TAW, 157-180 mm m-1, and the vertisols (TAW≥170 mm m-1). Alluvial/deluvial meadow and light-textured luvisol soils of small TAW≤116 mm m-1 are well identified over the terraces along the rivers. Materials and methods: Simulations are performed under a Transitional Continental (Plovdiv and Stara Zagora), a Moderate Continental (Sofia, Pleven, Silistra and Lom), a Transitional Mediterranean (Sandanski) and a North Black Sea (Varna) climate. V.Koinov, I. Kabakchiev, K. Boneva, 1998 The model was previously validated for maize hybrids of different sensitivity to water stress on soils of small, medium and large total available water (TAW) in various locations of Bulgaria (Popova et al., 2006; Popova, 2008; Popova and Pereira, 2010; Ivanova and Popova, 2011). Table 1. Variability of rainfed maize grain yield characterized by the average value, kg ha-1, and the coefficient of variation Cv, %, climate regions and soil groups in Bulgaria, 1951-2004. Map of Bulgaria with experimental fields of ISSAPPNP and meteorological stations of NIMH. Table 2. Parameters of specific relationships y=a+bx between simulated relative yield decrease RYD(%)/ net irrigation requirements NIRs (mm) and High Peak Season SPI2 “July-Aug” across considered soil groups and climate regions, Bulgaria, maize, 1951-2004 Results and findings: Fig.1 .Evolution of High Peak Season (July-Aug) SPI2 at: a) Sofia and b) Plovdiv, 1951-2004. Monthly precipitation in June, July and August relative to the average demand year are the largest in Sofia field, which is double than in Plovdiv, Sandanski, Lom and Varna (Fig.2). Table 3. Economical threshold of High Peak Season SPI2 “July-Aug” (the average SPI2 for July and August) indicating the risk relative to rainfed maize for climate region/soil groups in Bulgaria Deriving of drought vulnerability categories Specific drought indicators, relationships and economical thresholds are derived by relating seasonal SPI-index to simulation results of water stress impacts on rainfed maize yield and irrigation requirements (Fig.8, Tables 2 and 3). Popova Z.(Ed.) 2012 RISK ASSESSMENT OF DROUGHT IN AGRICULTUREAND IRRIGATION MANAGEMENT THROUGHSIMULATION MODELS Irrigation requirements Fig.2 Average monthly precipitation for the average (probability of exceedance of precipitation P=50%), wet (P=10%) and dry (P=90%) season at: a) Sofia and b) Plovdiv,May-Sept 1951-2004. Probability curves of maize net irrigation requirement (NIRs, mm) were built for each climate region and soil group using ISAREG model simulations over the period 1951-2004 (Figs. 3 and 4). a) b) b) b) Drought vulnerability mapping Results from Table 3, Soil map and Map of TAW of the soils are used for mapping the SPI2 “July-Aug” threshold. b) a) Fig.8 Relationships between seasonal SPI2 “July-Aug” (X-axis) and relative yield decrease of rainfed maize RYD with Ky=1.6 (Y-axis) at: a) Plovdiv and b) Pleven; soils of large TAW (180 mm m-1), late maize hybrids. Fig.3 Net irrigation requirements (NIRs) probability of exceedance curves relative to soil groups of small, medium and large total available water (TAW) at: a) Sofia field; b) Plovdiv, South Bulgaria, maize, 1951-2004. Maps of High Peak Season SPI2 “July-Aug” spatial distribution relative to the very dry (2000), the average (1970) and the moderately dry (1981) year are elaborated, as presented in Figs. 10a, 10b and 10c. The latter maps and derived relationships (Table 2) are used then to predict the distribution of yield losses of rainfed maize (Figs. 10d, 10e, 10f) or maize irrigation requirements in Bulgaria (Figs.10g, 10hand 10i). Fig.4 Comparison ofNet irrigation requirements (NIRs) probability curves relative to six climate regions and soil group of medium TAW, 136-157 mm m-1, maize, 1951-2004. Conclusions: The study relative to eight climate regions, three soil groups and the period 1951-2004, Bulgaria, shows that: Considering a trend of NIR for 1951-2004, an average increase by 80mm is found for Plovdiv; Contrarily, a 19% grain production decrease for rainfed maize is found there. Rainfed maize yield and risky years Relative yield decrease (RYD) probability of exceedance curves, built for each climate region and soils of medium TAW (136-157 mm m -1) are compared in Fig.7a. RYD is the largest in Sandanski ranging from 65 to 85% over the average demand years (40<PRYD<75%). It is also very high in Plovdiv (60<RYD<70%) but lower in Sofia and Pleven (30<RYD<50%) over the same years. In the very dry years (PRYD<5%) yield losses are over 95% in Plovdiv and Sandanski and more than 85% in Sofia field, Silistra, Pleven and Varna (Fig.7a). ٠In soils of large TAW (180 mm m-1), Plovdiv (Transitional Continental climate), net irrigation requirements (NIRs) range 0-40 mm in wet years and 350-380 mm in dry years. In soils of small TAW (116 mm m-1), NIRs reach 440 mm in the very dry year (Fig.3b). NIRs in Sofia and Silistra (Continental climate) are about 100 mm smaller than in Plovdiv while in Sandanski and Northern Greece (Transitional Mediterranean climate) they are 30-110 mm larger (Fig.4). SPI2 “July-Aug” Relative yield decrease (RYD, %) is simulated with option ‘maize without irrigation’ and yield response factor Ky = 1.6 for a soil of small TAW (116 mm m-1), Sofia and Plovdiv (Fig.5). Additional RYD data from long-term field experiments carried out with semi-early maize hybrids (Fig.5a) or late maize hybrids H708 (Fig.5b) are plotted as well. Results show that the adopted Ky=1.6 could reflect well the impact of water stress on rainfed maize yield in this country. Fig.9Map of economical SPI2 “July-Aug” threshold, under which soil moisture deficit leads to severe impacts on yield losses for rainfed maize, Bulgaria. ٠Rainfed maize is associated with great yield variability in this country (29%<Cv<72%). The smallest Cv refers to Sofia field for soils of large TAW (29%) while Cv=42% is typical for soils of small TAW there. The most variable yields are found in Sandanski (Cv=72%) and Plovdiv (Cv=69%) if TAW=116 mm m-1. The variability of rainfed maize yield in the Danube Plain (30<Cv<55%) is much lower than in the Thracian Lowland (Table 1). a) b) RYD ٠Considering an economical relative yield decrease (RYD) threshold of 60 and 48% of the potential maize productivity in Plovdiv and Sofia, 30 % of years are risky when TAW=180 mm m-1 in Plovdiv, that is double than in Sofia and half than in Sandanski (Fig.7b). In North Bulgaria the economical RYD threshold is 67, 55 and 60% for Pleven, Lom and Silistra. When TAW=180 mm m-1 only about 10% of the years are risky in Pleven and Silistra that is half than in Lom. When TAW is medium (157 mm m-1) the risky years rise to 19, 35 and 45 % in the three sites respectively and reach 50% in Varna (Fig.7a). a) NIR Fig.5 Probability of exceedance curve ofrelative yield decrease RYD for rainfed maize, Ky=1.6, soil of small TAW (116 mm m-1) at: a) Chelopechene, Sofia field, and b) Tsalapitsa, Plovdiv, 1951-2004. ٠In Plovdiv region reliable relationships (R2>91%) were found for seasonal agricultural drought relating the SPI2 for “July-Aug” with the simulated RYD of rainfed maize (Fig.8) while in Stara Zagora, Sandanski and Sofia the relationships were less accurate (73<R2<83%, Table 2). The study found statistically significant correlations between SPI2 “July-Aug” and simulated RYD of rainfed maize for North Bulgaria (R2>0.81) as well. When soil water holding capacity ranges (116<TAW<180 mm m-1) the relative yield decrease differs by about 20% (Fig.6). a) ٠When maize is grown without irrigation on soils of large TAW maize development is less affected by the water stress and economical losses are produced if high peak season SPI2 is less than +0.20 in Sandanski, -0.50 in Plovdiv and Stara Zagora and -0.90 in Sofia field (Table 3). This threshold ranges between -0.75 (Lom) and -1.50 (Pleven) for North Bulgaria. Corresponding NIR thresholds were identified. b) b) ٠The derived reliable relationships and specific thresholds of seasonal SPI2 “July-Aug”, under which soil moisture deficit leads to severe impact of drought on rainfed maize yield for the main climate regions and soil groups in Bulgaria, are representative of a wider area of Moderate Continental, Transitional Continental/Transitional Mediterranean and Black Sea climate in SEE. They are used for elaboration of drought vulnerability maps and identification of drought prone territories at regional and national level (Figs.9 and 10). Fig.10 Spatial distribution of seasonal SPI2 “July-Aug” a)-c)/ Relative yield decrease for rainfed maize(RYD, %) d)-f) / Net irrigation requirements (NIR, mm) g)-i) relative to the year of: a), d) and g) extreme (2000); b), e) and h) average (1970) and c), f) and i) moderate (1981) irrigation demand, Bulgaria Fig.6 Probability exceedance curves ofRYD of rainfed maize for soil groups of small, medium and large TAW, Ky=1.6, at: a) Plovdiv, South and b) Pleven, North Bulgaria, late maize hybrids (H708, 2L602, BC622), 1951-2004. Acknowledgements We gratefully acknowledge the financial support of Drought Management Center for South East Europe Project, Contract no. SEE/A/091/2.2/X, South East Europe Transnational Cooperation Programme co-funded by the European Union, for implementation and dissemination of our studies’ results on crop vulnerability to droughts and irrigation management in Bulgaria. Fig.7 Comparison ofrelative yield decrease (RYD, %) probability of exceedance curves, Ky = 1.6, six climate regions and two soil groups of: a) medium (136-157 mm m-1) and b) large (180 mm m-1) TAW, rainfed maize, 1951-2004. AGU Fall Meeting 3-7 December 2012, San Francisco, California