Download
1 / 41
410 likes | 526 Views
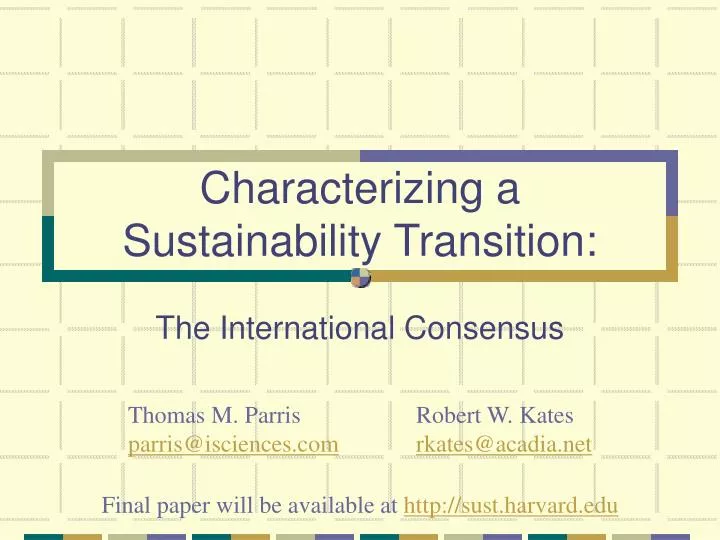
Characterizing a Sustainability Transition:. The International Consensus. Thomas M. Parris Robert W. Kates parris@isciences.com rkates@acadia.net. Final paper will be available at http://sust.harvard.edu. Acknowledgements.

E N D
Characterizing a Sustainability Transition: The International Consensus Thomas M. Parris Robert W. Kates parris@isciences.comrkates@acadia.net Final paper will be available athttp://sust.harvard.edu
Acknowledgements • Work supported by the Research and Assessment Systems for Sustainability Program (http://sust.harvard.edu/). • National Science Foundation (award BCS0004236) with contributions from the National Oceanic and Atmospheric Administration's Office of Global Programs.
Motivation • Defines a “transition to sustainability” when a stabilizing world population meets its needs, reduces hunger and poverty, while maintaining the planet's life support systems and living resources. • Notes that “there is no consensus on the appropriateness of the current set of indicators or the scientific basis for choosing them. Their effectiveness is limited by the lack of agreement on what to develop, what to sustain, and for how long.” Graphic of cover to National Research Council (NRC). 1999. Our Common Journey: A Transition Toward Sustainability. Washington, DC: National Academy Press.
Goal/Method • Goal • Produce a theoretically grounded, empirically validated, and politically accepted definition of a sustainability transition. • Method • Systematically review the state of international consensusas represented by formal agreements or plans of action. • Identify quantitative measures that can be used to determine if these consensus goals and targets are being met. • Make note of whether and by whom these measures are being monitored and assessed. • Select a relatively small number of priority sustainability indicators that capture the essence of the consensus.
Outline • Meeting Human Needs & Reducing Hunger and Poverty • Review of Consensus Goals and Targets • Priority Indicators • Preserving Life Support Systems • Review of Consensus Goals and Targets • Priority Indicators • Conclusions and Future Directions
Extending Life Quality • Strong iterated consensus on extending life quality as measured by: • Infant, childhood, and maternal mortality. • Incidence of various preventable diseases (e.g., polio, neonatal tetanus, measles, acute respiratory disease).
Childhood Mortality- State of the Consensus - Table 1b: Goals and Targets for Childhood Mortality
Infant/Childhood Mortality- State of the Indicators - Figure 1a: World Infant and Childhood Mortality Rates (WB, 2000)
Providing Education • Strong iterated consensus on providing education as measured by: • Access (net primary school enrollment) • Completion (% reaching grade 5) • Literacy • Male-female gaps in the above
Providing Education- State of the Consensus (1) - Table 3b: Illiteracy Table 3c: Male/Female Disparities
Providing Education- State of the Indicators (1) - Figure 3c: World Adult Illiteracy Rates (WB, 2000)
Providing Education- State of the Consensus (2) - Table 3c: Male/Female Disparities
Providing Education- State of the Indicators (2) - Figure 3e: World Illiteracy Gaps (WB, 2000)
Reducing Hunger • Strong iterated consensus to reduce three types of hunger. • Crisis hunger as measured by: • Starvation and death caused by famine. • Demands for emergency food assistance. • Chronic household hunger as measured by: • Number of undernourished people. • Prevalence of stunted and underweight children. • Micronutrient deficiencies as measured by: • Prevalence of iron deficiency. • Prevalence of iodine deficiency. • Prevalence of Vitamin A deficiencies.
Reducing Hunger- State of the Consensus - Table 4b: Chronic Household Hunger
Reducing Hunger- State of the Indicators - Figure 4d: Number of Undernourished in the Developing World (FAO, 2000)
Reducing Poverty • Recent consensus on reducing poverty as measured by proportion of people living on less than $1 per day. Table 5: Reduce Poverty
Reducing Poverty- State of the Indicators - Figure 5: Population Living Below $1.08 a day (1993 PPP)(Shaohua and Ravillion, 2000; WB 2001a)
Providing Housing & Employment • Consensus on housing and employment relatively weak.
Providing Housing & Employment- State of the Indicators - Source: WHO/UNICEF 2000 • At the end of 2000, approximately one third of the global work force of 3 billion people was unemployed, underemployed, or earn less than needed to keep their families out of poverty. (ILO, 2000)
Priority IndicatorsStrategy for Selection • Focus on indicators for which there are clear quantitative goals and targets. • Remove indicators that are highly related to one another except where needed to reiterate an important consensual statement. • When all else is equal, choose the indicator associated with the more difficult goal.
Priority IndicatorsGrading the Quality of Reporting and Assessment • A has been and continues to be routinely measured, reported, and assessed on a global basis. • B currently being measured, reported, and assessed on a global basis and is likely to be in the future. • C global and regional estimates are only possible through extensive modeling and extrapolation. • D only rough contemporary estimates vis-à-vis proxies are available.
Priority Human Needs Topics Priority Human Needs Indicators Quality of Reporting and Assessment Extending Life Quality Childhood Mortality A Education Literacy A Education M-F Literacy Gap A Reducing Hunger Prevalence of undernourishment C Reducing Hunger Prevalence of Vitamin A Deficiency D Reducing Poverty Poverty Rate C Providing Housing Access to improved sanitation services B Priority IndicatorsMeeting Human Needs & Reducing Hunger and Poverty Box 1: Priority Human Needs Indicators.
Preserving Life Support Systems • Consensus weaker than that for human needs, hunger, and poverty. • Consensus is diffused among numerous treaties and agreements (>470). • Relatively few issues addressed at global scale. • Most address regional or bi-lateral manifestations of global issues. • However, the many pieces of this fragmentary puzzle fit loosely together to form a more or less complete whole from which one can form the basis for an operational definition of sustainability.
Atmosphere & Climate • Major international agreements address: • Greenhouse Gases (UNFCC, Kyoto) • Substances that deplete the ozone layer (Vienna, Montreal, and subsequent) • Emissions of SOx, NOx, VOCs, and other tropospheric ozone precursors (LRTAP, US-Canada) • Toxics (mostly heavy metals) (Aarhus)
Atmosphere & Climate- State of the Indicators (1) - Graphic omitted due to space constraints. Figure 7a: Long-term Trends in Concentrations of Carbon Dioxide, Methane, and Nitrous Oxide (IPCC, 2001, pp. 6) Figure 7f: Past and Projected Concentrations of Stratospheric Chlorine and Bromine (WMO, 1998)
Atmosphere & Climate- State of the Indicators (2) - Figure 7g: Global Anthropogenic SOx Emissions (Lefohn, Husar, and Husar, 1999; Dignon and Hameed, 1989; Hameed and Dignon, 1992; IPCC 2000) Figure 7h: Global Anthropogenic NOx emissions (Dignon and Hameed, 1989; Hameed and Dignon, 1992; IPCC 2000)
Oceans • Three principal threads of agreements: • Protection of marine fisheries • By geography (e.g., Black Sea, Baltic Sea) • By specific species of particular interest and economic value (e.g., Whales, Salmon) • Land-based sources of pollution (e.g., Law of the Sea, Mediterranean Action Plan) • Similar to efforts to address fresh water pollution. • Ocean dumping from ships, aircraft, and exploration and mining (e.g., International Convention for the Prevention of Pollution from Ships). • Major emphasis on oil spills.
Oceans- State of the Indicators - Figure 8a: Global Trends in the State of World Fishery Stocks (FAO, 2000b) Figure 8c: Oil Spills Into Marine and Inland Environments From All Sources (DeCola, 2000)
Fresh Water • Only addressed internationally when water bodies cross national boundaries. • >260 international river basins(Wolf, et. al., 1999) • FAOLEX reports 120 international water treaties • Transboundary Freshwater Dispute Database lists 150 treaties (Yoff, Ward, and Wolf) • Three major threads of agreement: • Pollution (e.g., Rhine, Mosel) • Withdrawals (e.g., Ganga/Ganges) • Fisheries (e.g., Lake Victoria)
Fresh Water- State of the Indicators - Figure 9b: Global Water Withdrawal and Consumption (Shiklomanov, 1998)
Land Use/Cover Change • Mostly addressed in national and sub-national contexts. • International community becomes cases of large-scale land use/cover change phenomena. • Desertification (UNCCD) • Decline of large wetlands (RAMSAR) • Deforestation (ITTA) • Transformation of internationally recognized landmarks (Convention concerning the Protection of the World Cultural and Natural Heritage)
Land Use/Cover Change- State of the Indicators - Graphic omitted due to space constraints. Figure 10a: Annual Net Flux of Carbon Into the Atmosphere from Changes in Land Use (Houghton and Hackler, 2001) Figure 10b: Carbon Flux to the Atmosphere from Land Use Change (Houghton and Hackler, 2001)
Living Resources • Large number of agreements. Major threads include: • Marine and freshwater living resources (see above) • Biological Diversity (CITES, CBD) • Reserves/Protected Areas (e.g., African Convention on the Conservation of Nature and Natural Resources) • Control of invasive species and pests (e.g., International Plant Protection Convention)
Living Resources- State of the Indicators - • Recent extinction rates are 100 to 1000 times their pre-human levels (Pimm, et. al., 1995). • At present, 11% of bird species, close to 18% of mammals, roughly 8% of plant species, and 5% of fish species are currently threatened (Chapin, et. al, 2000; Vitousek, et. al., 1997). • Freshwater species are reported to be the most threatened group of vertebrates harvested by humans; however accurate data are hard to collect. In area where studies have been carried out, about 20 percent of freshwater species are threatened, endangered, or extinct" (FAO, 2000b). • Over 850 million hectares, 6% of the world's land area, are now designated as protected areas (IUCN management categories I-V) (WRI, 2000, Table BI.1). • While there is clear evidence that invasive species pose significant threats to specific valued species and biodiversity in general, efforts to quantify the number, extent, and impact of invasive species over time on a global scale are still in their formative stages (Drake and Mooney, 1989; IUCN).
Toxics • Media specific agreements noted above. • General agreement on: • Heavy metals (e.g., Convention Concerning the Use of White Lead in Painting) • Nuclear Radiation (e.g.,Treaty Banning Nuclear Weapon Tests in the Atmosphere, in Outer Space and under Water ) • Persistent Organic Pollutants (Stockholm Convention on Persistent Organic Pollutants)
Toxics- State of the Indicators - • Global annual emissions of dioxins and furans are estimated to be 50±10 kg international toxic equivalency units where tolerable adult daily intake is one to four picograms (10-12 grams) per kilogram body weight (UNEP/Chemicals, 1999). Figure 11a: Global emissions of metals to the atmosphere in 1983, natural versus anthropogenic. (AMAP, 2001) The percentages shown in the bars are based on range values and therefore do not sum to 100 percent
Priority Indicators- Preserving Life Support Systems - Box 2: Priority Life Support System Indicators
Conclusions (1) • Existing international consensus provides an effective framework for defining a sustainability transition in terms of: • What is to be developed • What is to be sustained • Over what time periods • Emphasis on existing international consensus justifies selection of 14 priority indicators – a small number relative to other efforts.
Conclusions (2) • Some progress, but not complete success in many of the agreed upon indicators for human development. • General agreement on range of issues to address in relation to preserving life support system issues. • Few concrete goals and targets, assessment mechanisms, or means of effective implementation. • One can imagine re-arranging the current haphazard framework into one organized along the lines of ecosystem services.
Future Directions • Operationalize key indicators to inform whether we are moving nearer to or farther away from a sustainability transition. • Aggregate set of 14 indicators into 3 overall indicators for meeting human needs, reducing hunger and poverty, and preserving life support systems. • Test sensitivity of indicator selection to scale. • Analyze driving forces and opportunities for policy intervention that will shape future trends and transitions.