Download
1 / 17
180 likes | 319 Views
APPLICATIONS OF SYSTEM DYNAMICS TO MODELING POVERTY TRAPS AND LAND DEGRADATION IN EAST AFRICA. Investigators C. BARRETT - CORNELL A. PELL - CORNELL B. OKUMU - CORNELL F. MURITHI - KARI F. PLACE - ICRAF

E N D
APPLICATIONS OF SYSTEM DYNAMICS TO MODELING POVERTY TRAPS AND LAND DEGRADATION IN EAST AFRICA Investigators C. BARRETT - CORNELL A. PELL - CORNELL B. OKUMU - CORNELL F. MURITHI - KARI F. PLACE - ICRAF J. RASAMBAINARIVO - FOFIFA
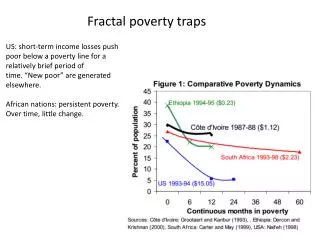
Problem Statement Agrarian poverty may create incentives to follow land and livestock management practices which further reduce agricultural labor productivity by depleting natural capital: resource degradation poverty traps (RDPTs). • Key Sources of RDPTs (threshold effects): -missing/imperfect factor, product and asset markets - biologically-induced non-convex technologies
Study Objectives • Examine empirically how biological processes and market conditions interact to create or extend dynamic poverty traps • Simulate policy experiments that might sustainably reduce poverty and/or improve resource management • Build capacity with local partners to carry out such analysis and simulations locally
Research Design Drier 1.Central highlands, Kenya (Embu) 2. Central highlands, Madagascar (Vakinankaratra) 1. North Central Kenya (Baringo) Better MARKET ACCESS 1. Northern Kenya(Marsabit) 1. Western Kenya (Siaya /Vihiga) 2. Southern highlands, Madagascar (Fianarantsoa) Worse Wetter AGRO-ECOLOGICAL CONDITIONS
Research Sites Kenya Madagascar
MODEL FRAMEWORK State or decision variables HUMAN Soil/water conservation, fertilizer, brown & green manure application Milk meat traction Savings Manure crops, green manure Herd size + species husbandry, feeding practices ENVIRONMENTAL & POLICY FACTORS - rainfall, - temperature - slope - prices - land tenure - land use restrictions crop production practices land use patterns LIVESTOCK Geographical effects Forage feed PLANT BIOMASS - Natural vegetation - crops -Soilnutrients, - moisture Excreta, litter, - Soil cover - Soil organic matter (SOM) SOIL -Biology (microbes, micro-fauna and flora) -Chemistry (N, P, K) - Physics (structure, texture, moisture content)
Study Methodology • SD approach is chosen because it is consistent with traditional economic approaches towards modeling dynamic systems i.e. use of ordinary differential or difference equations • It employs a very simplified structure of feedback and causal loops that are either balancing (stable equilibrium) or reinforcing (unstable equilibrium) • It is possible to integrate or nest micro-economic models in the SD framework
Study Methodology... Cont’d • SD yields numerical estimates of the paths taken by key policy variables over time and space as well as any equilibrium to which they might converge (diverge) • Simulate policy experiments that might sustainably reduce poverty and/or improve resource management • Uses both quantitative and qualitative information
Rainfall ratio : Normalized rainfall for Embu 1977-1999 Graph for rainfall ratio 2 1.5 1 0.5 0 1977 1981 1985 1989 1993 1997 Time (Year) Mean: 1270 Max: 1885 Min: 499
Simulation of ICRAF/KARI technologies on Soil depth levels 100 95 90 85 80 1977 1979 1981 1983 1985 1987 1989 1991 1993 1995 1997 1999 Time (Year) Soil depth : without technology interventions cm Soil depth : with technology interventions cm
Sensitivity analysis of soil depth decline 50% 75% 95% 100% Soil depth 100 95 90 85 80 1977 1983 1988 1994 1999 Time (Year)
Policy Relevance • Models such as this one could be used to simulate policy experiments, allowing for differences according to market and agroecological conditions. For example - What are the consequences of improving market access on poverty and soils over time? - How might biological interventions (e.g., liming soils, extending improved fallows) change labor allocation and income trajectories? - What targeting mechanisms and transfer forms (e.g., livestock species) are likely to prove most effective in sustainably reducing agrarian poverty?