Download
1 / 66
660 likes | 719 Views
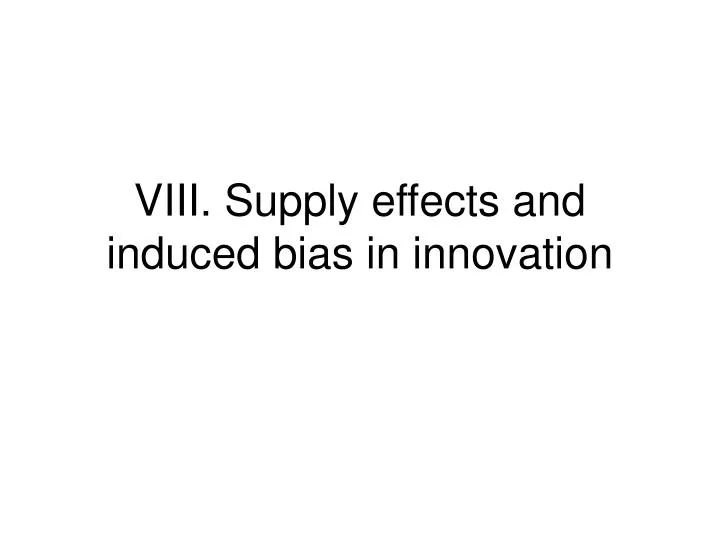
VIII. Supply effects and induced bias in innovation. Induced Bias. Traditionally, one assumes that TP enters the production function in some exogenous way What if innovators can ex-ante seek to obtain a given type of technical progress?

E N D
Induced Bias • Traditionally, one assumes that TP enters the production function in some exogenous way • What if innovators can ex-ante seek to obtain a given type of technical progress? • That is what the old “induced bias” literature tries to model
The traditional view • Innovation augmenting one factor increases the return to the other factor • Because of such “bottlenecks”, further innovation will be biased in favor of the other factor • We eventually expect innovation to be “balanced” • These bottlenecks imply that if one factor is more abundant, innovation will favor the other factor, to compensate
The modern view (Acemoglu) • There exists market size effects: profits from an innovation depend positively on its market size • Market size is larger if factor affected by innovation is more abundant • This effect tends to reinforce existing biases rather than compensate them
Consequences for the distribution of wages • If market size effects dominate bottleneck effects, then an increase in H/L triggers skilled-biased innovations • These innovations themselves increase the skill premium, • Which in turn induces people to accumulate more human capital…
A simple heuristic argument • Suppose firms could “pay” for technical progress in one dimension or another • How much are they willing to pay? • That gives us an idea of where TP is going to take place • Firms willing to pay more more profits for innovators
The logic • Production function • Marginal product conditions • Cost function • Willingness to pay per unit of output
The equilibrium MWP for technical progress • Diferentiating cost functions and substituting MP conditions, we get
Interpretation • Because of optimality, how I reduce costs is irrelevant at the margin • Suppose, upon an increase in A, that I reduce L proportionally • I produce the same, and costs are reduced by wLdA/A = F’1LdA
What happens to MWP when factor endowments change? • Assume H goes up • The wage of human capital falls, thus reducing my savings from human capital augmenting technical progress (bottleneck effect) • But a proportional reduction in H would affect more people, and thus be more profitable (market size effect)
Implications for the induced bias • Assume the bias in TP adjusts so as to equate MWP across types of TP • Then the endogenous bias is determined by • That formula determines the endogenous skilled bias b = B/A as a function of the factor endowment h = H/L
Which effect dominates? • db/dh > 0 if curvature of f not too large • Bottlenecks are small if H and L are substitute, market size effects then dominate • Botlleneck effects are large if complementarities between H and L strong enough
Net effect on the skill premium • While an increase in H/L induces SBTC, skill premium need not go up on net • For skill premium to go up, the positive effect of induced technical change must be higher than the direct negative effect of a greater H/L
The net effect on the skill premium • To get an increase in the skill premium, we need a more than proportional response of b to h • That implies even less complementarity
An endogenous innovation model • Can the preceding analysis be made more rigorous by explicitly taking innovation into account? • The answer is: yes • And the analysis and intuition are basically similar
The model’s ingredients • We need a simple model of endogenous innovation • Building on Romer, we assume innovation introduces new varieties • These varieties enter as inputs into the production of aggregate intermediate goods • Two categories of varieties depending on whether H or L is used • Two different aggregate intermediate goods
From product diversity to factor productivity: • As in Romer, the CES aggregate for the intermediate input entails « taste for diversity » • Hence, an increase in the number of varieties is equivalent to technical progress which increases the efficiency of the relevant factor
The production structure • Aggregate production function: • l-aggregate uses l-inputs: • Similarly for h: • l-inputs use labor • Similarly for h
Computing aggregate factor productivity • By symmetry, all goods of the same kind are produced in the same quantity • Therefore, yl = L/Nl and yh = H/Nh • Hence, Yl = AL, Yh = BH, Y = F(AL,BH)
Pricing • Individual price-setters face constant elasticity • Using price index for intermediate aggregates, we get • Profit maximization for the final good allows to recover wages
Profits • In equilibrium, labor uniformly allocated • This allows to compute quantities, and thus profits
Patents and innovation • The value of a patent is given by • In an interior BGP, Vh = Vl throughout, implying
Profit equalization allows to compute equilibrium bias in technology • We get a formula quite similar to the heuristic model:
The effects • When a factor is in larger supply, any intermediate good which uses that factor will have a larger market (Market size effect) term in H/L • If a factor is more abundant in efficiency units, its marginal product falls, which reduces the demand for the corresponding intermediate inputs (Bottleneck effect) term in F’1/ F’2 • If a factor is more productive, it means more intermediate goods for that factor, and lower market size term in (B/A)1-η • If a factor is more productive, its price is higher, which boosts prices and profits for intermediate goods term in (B/A)
The CES case • Relative profits are equal to • That determines a stable interior value of b provided • That value is then given by
When does the supply effect increase the bias? • Clearly, db/dh > 0iff γ > 0 • Substitutability market size effects dominate • Complementarity bottleneck effects dominate
When does the skill premium go up on net? • The skill premium is given by • It is increasing in h provided
Discussion • Again, more substitutability is needed for the SP • The bias must react enough to h • Furthermore, condition more likely when ηis smaller • ηis smaller b more reactive to h • The lower η, the lower the increase in N associated with a given increase in A, the smaller the profit dissipation effect associated with an increase in A
Dynamics • Assume a fixed supply of researchers • They can pick any kind of innovation at any point in time • Assume a productivity spillover à la Grossman-Helpman • At each date, all researchers work in the most profitable kind of R & D • Unless patent values are equalized, they are then indifferent
dΔ/dt = 0 Δ D C db/dt = 0 E E D b Figure 5.7: the dynamics of the technology bias
b* b =B/A Figure 5.8: convergence path of the technology bias
dΔ/dt = 0 Δ C’ db/dt = 0 C b Figure 5.9: response of the technology bias to an increase in H/L
b A time b B time Figure 5.10: response of the skill premium to an increase in H/L
The limitations of neo-classical models • In neo-classical models, individuals are irrelevant • They earn the sum of the income of the characteristics they bring to the market • Where they work and whom they work with does not matter • We now turn to models where individuals matter
The role of unbundling • A first mechanism by which individuals may matter is unbundling • Unbundling means that all the characteristics of the individual must be supplied to the same employer • We will show that the price of each characteristic then need not be equal across sectors • One implication is that people will sort themselves into different sectors by different skills
Back to the basic model • Each worker has a skill s • Skill determines h(s) and l(s) • We order skills by comparative advantage so that h(s)/l(s) grows with s • Workers can’t elect which characteristic they supply
A pseudo-obvious result • If there is a single homogeneous final good, then each worker earns an income • Where ωand w are the economy-wide price of H and L • In the unbundling model, that result is obvious • But is is not in the bundling model • We have to prove that each firm offers the same return to each characteristic
The firm’s optimization problem • To complete the proof we need to show that these MPs are equalized across firms • Workers are paid the marginal roduct of their characteristics in the firm where they work
Completing the proof • In equilibrium, all firms have the same H/L ratio • Therefore, each marginal product is equalized across firms • Otherwise, firms with a higher H/L pay more for L and less for H • But then they attract lower-skilled workers and cannot have a higher H/L ratio
The 2-sector model • Firms in different sectors sell their output at different prices • A non unique price may be supported • Example: sector 1 pays more for H and attracts the higher skilled workers • It does so not because it has a lower H/L ratio, but because its production is more intensive in H
The model • Under unbundling, the allocation is determined by standard considerations • The two FPF interact if both goods are produced • Each factor price is unique
ω E PFPFB PFPFA -L/H w Figure 6.1: factor-price equalization in the two-sector model