Download
1 / 50
500 likes | 600 Views
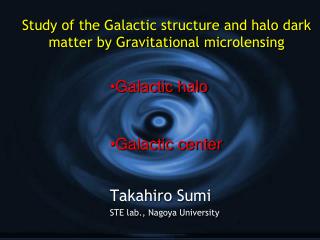
The Microlensing Event Rate and Optical Depth Toward the Galactic Bulge from MOA-II . Takahiro Sumi (Osaka University). Galactic Bar. de Vaucouleur,1964, gas kinematics Blitz&Spergel,1991, 2.4μm IR luminosity asymmetry Weiland et al.,1994, COBE- DIRBE,confirmed

E N D
The Microlensing Event Rate and Optical Depth Toward the Galactic Bulge from MOA-II Takahiro Sumi (Osaka University)
Galactic Bar • de Vaucouleur,1964, gas kinematics • Blitz&Spergel,1991, 2.4μm IR luminosity asymmetry • Weiland et al.,1994, COBE-DIRBE,confirmed the asymmetry. • Nakada et al.,1991, distribution of IRAS bulge stars • Whitelock&Catchpole, 1992, distribution of Mira • Kiraga &Paczynski,1994 Microlening Optical depth 8kpc
Weiland et al.,1994, confirmed the asymmetry. COBE-DIRBE all extinction correct disk subtracted
RCG by IR (Babusiaux & Gilmore, 2005) Deep survery by Cambridge IR survery instrument (CIRSI) =225.5
8kpc Obs. G.C. (face on, from North) Microlensing Optical depth, andthe Galactic Bar structure Microlensing Optical depth, (Alcock et al. 2000; Afonso et al.2003; Sumi et al. 2003;Popowski et al. 2004; Hamadache et al. 2006;Sumi et al. 2006) M=1.61010M, axis ratio (1:0.3:0.2), ~20
Microlensing event rate: Ns: number of source To: duration of the survey ε(tE):detection efficiency at tE Optical depth: τ=Γ×<tE>=Γ×(π/2)tE
High [use All stars as source] 3.310-6, OGLE (Udalski et al. 1994) 3.910-6, MACHO, (Alcock et al. 1997) 2.43(3.23)10-6, MACHO, (Alcock et al. 2000) 2.59(3.36)10-6, MOA, (Sumi et al. 2003) Low [use Red Clump Giant (RCG)] 2.010-6, MACHO, (Popowski et al. 2001) 0.9410-6, EROS, (Afonso et al. 2003) 2.1710-6, MACHO, (Popowski et al. 2004) =2.5510-6,OGLE-II, (Sumi et al. 2006) Previous measurements of optical depth, tE/(Ns) • 0.810-6, symmetric bulgemodel • <210-6, theoretical bar models
Test Optical depth with unblended fit OGLE-II, (Sumi et al. 2006) 50% more events, 30% higher efficiency, 21% underestimate tE, =2.00.410-6, =2.5510-6, with blending fit
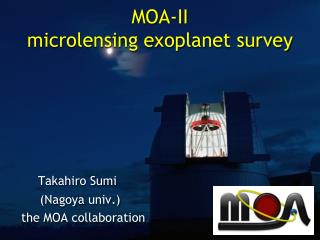
MOA (since 1995)(Microlensing Observation in Astrophysics)( New Zealand/Mt. John Observatory, Latitude: 44S, Alt: 1029m)
MOA-II 1.8m telescope Mirror : 1.8m CCD : 80M pix. FOV : 2.2 deg.2 First light: 2005/3 Survey start:2006/4
Observational fields • 50 deg.2 • 50 Mstars • 1obs/1hr • 1obs/10min. disk Galactic Center ~600events/yr http://www.massey.ac.nz/~iabond/alert/alert.html Each field has 80 10’x10’subfields
subtracted Difference Image Analysis (DIA) Observed
All source & RCG Sample Extended RCG region 10’x10’subfield All source: I <20 mag
Timescale tE distribution abundance:~1.8 as common as stars Mass : 〜Jupiter mass 474 events selected from 1000 candidates in 2 yrs Known objects 474events Main sequence White dwarf Brown dwarf Neutron star Planetary-mass objects Black hole TS et al. 2011, Nature, 473, 7347, 349-352
Fitting with Poisson Statistics Not Poisson -> need bootstrap Only the detection efficiency of the detected events in the subfield in question are used. Poisson statistic Can use larger area for Average Efficiency Even if there is a few events in the subfield Original: New: Average Efficiency:
Simulation Put artificial events on real images • Sampling • noise • Artifacts • Nearby bright star, • Nearby variable star • Nearby high proper motion star • Differential refraction Subtracted image Art image
Input time scale tE,inv.s. output tE,out tE,in= tE,out mean of tE,in(tE,out) ~5% smaller 90% interval Bias is only ~5% in all range
Cumulative distribution of the impact parameters, u0 Simulation data
Optical depth All source result is middle of previous all and RCG source results. RCG is 30% lower than all source
tEdistribtution Efficiency corrected
Event rate Γ(/star/yr) 60% higher rate than the rate in WFIRST SDT report (Green et al. 2012)
Optical depth τ Each box: 10’x10’subfield GC Weighted average by 2D gaussian with σ=0.4deg max at low latitudes and a longitude of l ≈ 3.5◦
Time scale, tE GC Weighted average by 2D gaussian with σ=0.4deg max at a longitude of l ≈ 3.5◦ A reason of high optical depth at≈ 3.5◦
Event rate Γ(/star/yr) GC WFIRST Weighted average by 2D gaussian with σ=0.4deg max at low latitudes and a longitude of l ≈ 1◦
Summary • By using 474 events from 2 years of MOA-II data, we found: • τ200= [2.35 ± 0.18]exp[0.51±0.07](3−|b|) × 10−6 • Γ = [2.39 ± 1.1]exp[0.60±0.05](3−|b|) × 10−5 star−1 yr−1 • Event rate is maximized at low latitudes and a longitude of l ≈ 1◦. • All source and RCG are consistent in Γ • Our optical depth are consistent with previousmeasurements, somewhat lower than previous all-source measurements and slightly higher than previous RCG measurements. This suggests that the previously observed difference between all-source and RCG samples may be largely due to statistical fluctuations or due to how to hand the blending. • 60% higher event rate than assumed in the report of the WFIRST SDT (Green et al. 2012).
Event rate Γdeg2(/deg2/yr) Weighted average by 2D gaussian with σ=0.4deg
Best fit Model Event rate Γ& Γdeg2 Γ(/star/yr) Γdeg2(/deg2/yr)
Optical depth, • =2.550.4510-6, at (l,b)=(1.2,-2.8) • Consistent with measurements with RCGs by Afonso et al (2003) and Popowski et al. (2004) • Consistent with the bar model with M=1.61010M, axis ratio (1:0.3:0.2) =20, (Han & Gould, 1995) Few dark matter. Exclude NFW Dark halo (Binny & Evans, 2001)
Is v.s. Itotal Level 6: 34/66 candidates 38% of events are blended
2.Red Clump Giants • Metal-rich horizontal branch stars • Small intrinsic width in luminosity function (~0.2mag) =20-30, axis ratio 1:0.4:0.3 Stanek et al. 1997
Brightness of RCG & RRLyrae RCG (Sumi 2004; Collinge, Sumi & Fabrycky, 2006) RCG 2000 RRLyrae 2000 RRLyrae
Degeneracy in parameters Einstein crossing time:
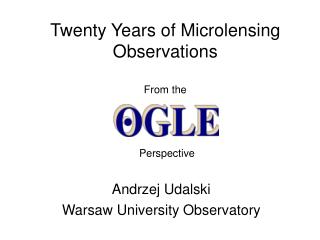
3.Streaming motions of the bar with RCGSumi (Princeton) , Eyer (Geneva Obs.) & Wozniak (Los Alamos), 2003 Sun Color Magnitude Diagram faint bright Vrot=~50km/s Sumi, Eyer & Wozniak, 2003
DoPHOT 9 events. Udalski et al. 1994 DoPHOT 13 events Alcock et al. 1998 DIA 99 events Alcock et al. 2000 DIA 28 events Sumi et al. 2002 Axisymmetric Galactic bulge model Kiraga & Paczynski 1994, Evans 1994 etc. Bar model with Small inclination angle. Paczynski et al.1994, Zhao et al. 1995 etc. Microlensing Optical Depth
DATA NRCG= 1 Million Red Clump Giant (RCG) stars as source stars
Pieces of information • Microlensing Optical depth, and Event Timescale, tE=RE/Vt, (Sumi et al. 2006) • Brightness of Red Clump Giant (RCG) and RRLyrae stars, (Stanek et al. 1997, Sumi 2004; Collinge, Sumi & Fabrycky, 2006) • Proper motions of RCG, (Sumi, Eyer & Wozniak, 2003; Sumi et al. 2004), Proper motion of 5M stars, I<18 mag, ~1mas/yr
Free-Floating Planet, events with timescale tE<2days M:lens mass MJ: Jupiter mass D:distance vt: velocity ~20days for stars tE=1.2days ~Jupiter mass 1day As Many FFP as stars! Sumi et al. 2011 MOA and OGLE WFIRST can detect Earth-mass FFP
Optical depth, • =2.550.4510-6, at (l,b)=(1.2,-2.8) • Consistent with measurements with RCGs by Afonso et al (2003) and Popowski et al. (2004) • Consistent with the bar model with M=1.61010M, axis ratio (1:0.3:0.2) =20, (Han & Gould, 1995)