Download
1 / 1
10 likes | 176 Views
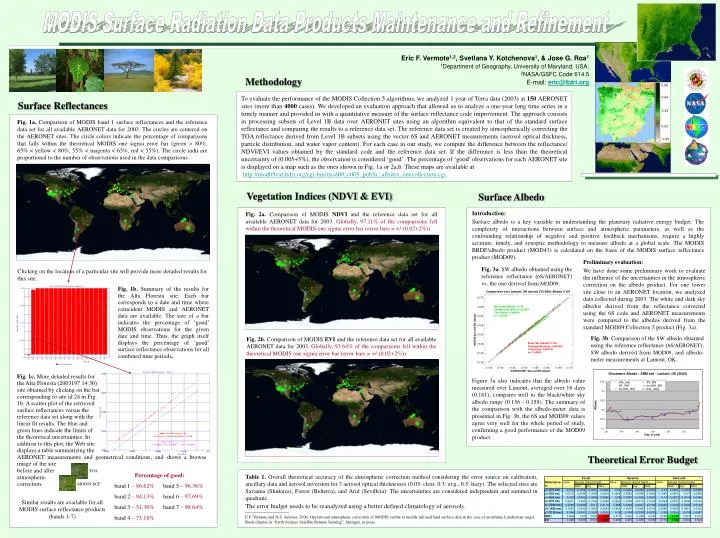
Fig. 2a. Comparison of MODIS NDVI and the reference data set for all available AERONET data for 2003. Globally, 97.11% of the comparisons fell within the theoretical MODIS one sigma error bar (error bars = +/-(0.02+2%)).

E N D
Fig. 2a. Comparison of MODIS NDVI and the reference data set for all available AERONET data for 2003. Globally, 97.11% of the comparisons fell within the theoretical MODIS one sigma error bar (error bars = +/-(0.02+2%)). Clicking on the location of a particular site will provide more detailed results for this site. Fig. 1b. Summary of the results for the Alta Floresta site. Each bar corresponds to a date and time where coincident MODIS and AERONET data are available. The size of a bar indicates the percentage of ‘good’ MODIS observations for the given date and time. Thus, the graph itself displays the percentage of ‘good’ surface reflectance observations for all combined time periods. Comparison over Lamont, OK (period 273-288): Albedo 0.161 0.170 0.165 0.160 0.155 0.150 0.145 0.140 0.135 White Sky Albedo: 0.158 Standard deviation: 0.000525 Correlation: 0.996654 a = 1.00534 MOD09 derived SW albedo Fig. 2b. Comparison of MODIS EVI and the reference data set for all available AERONET data for 2003. Globally, 93.64% of the comparisons fell within the theoretical MODIS one sigma error bar (error bars = +/-(0.02+2%)). Black Sky Albedo: 0.156 Standard deviation: 0.000443 Correlation: 0.997531 a = 1.00829 0.135 0.140 0.145 0.150 0.155 0.160 0.165 0.170 6S/AERONET derived SW albedo Fig. 1c. More detailed results for the Alta Floresta (2003197 14:30) site obtained by clicking on the bar corresponding to site id 24 in Fig. 1b: A scatter plot of the retrieved surface reflectances versus the reference data set along with the linear fit results. The blue and green lines indicate the limits of the theoretical uncertainties. In addition to this plot, the Web site displays a table summarizing the AERONET measurements and geometrical conditions, and shows a browse image of the site before and after atmospheric correction. TOA MOD09-SCF MODIS Surface Radiation Data Products Maintenance and Refinement Eric F. Vermote1,2, Svetlana Y. Kotchenova1, & Jose G. Roa1 1Department of Geography, University of Maryland, USA; 2NASA/GSFC Code 614.5 E-mail: eric@ltdri.org Methodology 0.98 To evaluate the performance of the MODIS Collection 5 algorithms, we analyzed 1 year of Terra data (2003) at 150 AERONET sites (more than 4000 cases). We developed an evaluation approach that allowed us to analyze a one-year long time series in a timely manner and provided us with a quantitative measure of the surface reflectance code improvement. The approach consists in processing subsets of Level 1B data over AERONET sites using an algorithm equivalent to that of the standard surface reflectance and comparing the results to a reference data set. The reference data set is created by atmospherically correcting the TOA reflectance derived from Level 1B subsets using the vector 6S and AERONET measurements (aerosol optical thickness, particle distribution, and water vapor content). For each case in our study, we compute the difference between the reflectance/ NDVI/EVI values obtained by the standard code and the reference data set. If the difference is less than the theoretical uncertainty of (0.005+5%), the observation is considered ‘good’. The percentage of ‘good’ observations for each AERONET site is displayed on a map such as the ones shown in Fig. 1a or 2a,b. These maps are available at http://mod09val.ltdri.org/cgi-bin/mod09_c005_public_allsites_onecollection.cgi. 0.66 Surface Reflectances 0.34 Fig. 1a. Comparison of MODIS band 1 surface reflectances and the reference data set for all available AERONET data for 2003. The circles are centered on the AERONET sites. The circle colors indicate the percentage of comparisons that falls within the theoretical MODIS one sigma error bar (green > 80%,65% < yellow < 80%; 55% < magenta < 65%, red < 55%). The circle radii are proportional to the number of observations used in the data comparisons. 0.02 -0.30 Vegetation Indices (NDVI & EVI) Surface Albedo Introduction: Surface albedo is a key variable in understanding the planetary radiative energy budget. The complexity of interactions between surface and atmospheric parameters, as well as the confounding relationship of negative and positive feedback mechanisms, require a highly accurate, timely, and synoptic methodology to measure albedo at a global scale. The MODIS BRDF/albedo product (MOD43) is calculated on the basis of the MODIS surface reflectance product (MOD09). Preliminary evaluation: We have done some preliminary work to evaluate the influence of the uncertainties in the atmospheric correction on the albedo product. For one tower site close to an AERONET location, we analyzed data collected during 2003. The white and dark sky albedos derived from the reflectance corrected using the 6S code and AERONET measurements were compared to the albedos derived from the standard MOD09 Collection 5 product (Fig. 3a). Fig. 3a. SW albedo obtained using the reference reflectance (6S/AERONET) vs. the one derived from MOD09. Fig. 3b. Comparison of the SW albedo obtained using the reference reflectance (6S/AERONET), SW albedo derived from MOD09, and albedo-meter measurements at Lamont, OK. Figure 3a also indicates that the albedo value measured over Lamont, averaged over 16 days (0.161), compares well to the black/white sky albedo range (0.156 - 0.158). The summary of the comparison with the albedo-meter data is presented in Fig. 3b, the 6S and MOD09 values agree very well for the whole period of study, confirming a good performance of the MOD09 product. Theoretical Error Budget Percentage of good: band 1 – 86.62% band 5 – 96.36% band 2 – 94.13% band 6 – 97.69% band 3 – 51.30% band 7 – 98.64% band 4 – 75.18% Table 1. Overall theoretical accuracy of the atmospheric correction method considering the error source on calibration, ancillary data and aerosol inversion for 3 aerosol optical thicknesses (0.05: clear, 0.3: avg., 0.5: hazy). The selected sites are Savanna (Skukuza), Forest (Belterra), and Arid (Sevilleta). The uncertainties are considered independent and summed in quadratic. The error budget needs to be reanalyzed using a better defined climatology of aerosols. Similar results are available for all MODIS surface reflectance products (bands 1-7) E.F. Vermote and N.Z. Saleous, 2006, Operational atmospheric correction of MODIS visible to middle infrared land surface data in the case of an infinite Lambertian target, Book chapter in “Earth Science Satellite Remote Sensing”, Springer, in press.