Download
1 / 41
410 likes | 563 Views
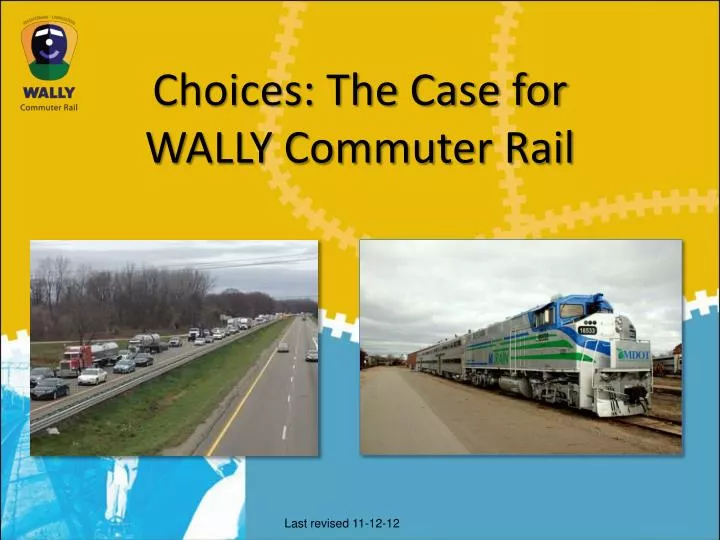
Choices: The Case for WALLY Commuter Rail. Last revised 11-12-12. Why WALLY? US 23 Trends…. WALLY Commuter Rail Service. Commuter coaches pushed-pulled by locomotives. Comfortable car interiors. Stations will typically include parking and / or connecting bus service.

E N D
Choices: The Case for WALLY Commuter Rail Last revised 11-12-12
WALLY Commuter Rail Service • Commuter coaches pushed-pulled by locomotives • Comfortable car interiors • Stations will typically include parking and / or connecting bus service
WALLY Commuter Rail Service • Passenger service on an existing freight line Howell Station • Stations planned for Howell, Genoa Twp, Hamburg Twp, Whitmore Lake and Ann Arbor Genoa Twp Station Hamburg Livingston County Whitmore Lake Station Washtenaw County • Initially 4 trains each direction per day • Connecting buses in Ann Arbor will serve North Campus, Medical Center, and downtown Ann Arbor Station Downtown (potential future station) Stadium (potential future station)
Benefits for Commuters Safe and reliable in any weather A comfortable, relaxing commute Avoid parking hassles and costs, and the cost of gasoline Mobility option for non-drivers
Benefits for the Region Property Values Investment “Public transportation infrastructure is a common variable in corporate site selection decisions…a prerequisite for European and Asian business leaders.” Michael Finney, President and CEO, Ann Arbor SPARK 5% - 20% or more Jobs Workforce Retention Livable residential communities tied to strong urban centers 775 Construction 290 Permanent Energy Use Air Pollution 580,000 gallons of gasoline annually 3000 tons / year of CO2
Efficient Use of Transportation Resources • Compares favorably with other proposed projects • Capital investment = $2.09 / trip (over the twenty-year life of the assets) • Net operating expense = 63¢ / passenger-mile • Projected fare box recovery ratio = 30% • Ease pressure for $500M widening of US-23 • Reduce Ann Arbor parking construction costs • Backbone for an area-wide transportation system • Not either/or • Balance, choice, flexibility
Status: Capital Improvements • Rolling stock: railcars & locomotives • Upgraded tracks • Improved grade crossing safety • Signal improvements • Layover facilities • Stations
Status: Railcar Rehabilitation • Work is underway in Michigan– Great Lakes Central RR • 23 Cars Undergoing Rehabilitation • 19 Cars Completed as of October, 2012 • 6 Cars Have passed low speed dynamic testing, and are scheduled for track speed testing between Pontiac and Jackson soon • Completion Expected February 2013 • WALLY Service to Use Up to 15 cars • New fabric seats • Windows – buffed out or replaced • Wheelchair access • Logos / Painting / Flooring • Costs – Funding by MDOT • Coordination with Detroit-to-Ann Arbor project
Status: Locomotive Lease • Delivery Schedule Being Re-evaluated • MDOT Funded • Coordination with Detroit-to-Ann Arbor project
Status: Track, Grade Crossings • Track and crossing improvements • Major Work, Summer 2010 • Rail, ballast and tie replacement and rehabilitation • MDOT funded • Grading crossing protection • Design / scoping is underway • 34 public crossings • Funding being sought • Construction 2013?
Status: Signals • Main line to run “dark” initially • No conflicting movements • Annpere crossing • Scope TBD • Meet with CSX • Positive Train Control?
Status: Layover Facilities • Overnight – Oak Grove • Midday - Osmer • Alternatives to Osmer • Barton Road • Michigan Stadium • Osmer Construction Completed • Layover Equipment Needed • MDOT Funded
Status: Stations • Preliminary cost estimates (2007) need update • Station Design and Location Study starts soon • Determine locations, detailed site and structure designs, environmental impacts, AARR issues • Funding sources: • Howell, Ann Arbor DDA, Washtenaw Co. • FTA Section 5304 grant • Transportation, Community and System Preservation (TCSP) Program • Community Participation
Capital Improvements Summary • Current capital cost estimate = $41.0 M • Includes options • Continuously welded rail • Additional grade crossing protection • Value of work completed = $6.1 M • Remaining work, required = $18.9 M • Remaining work, optional = $16.0 M • All costs under review, update planned
Operating Plan • 4 inbound movements during am peak • Store 4 trains near downtown Ann Arbor • Crews go off-duty until afternoon peak • 4 outbound movements during pm peak
Project Operating Costs and Revenues(Millions) • Overall cost = $7.1 M annually per R.L. Banks • Fare revenue assumes 1300 riders per day • CTF share assumes overall viability of the fund • Wildcards: insurance, trackage rights • Sources to close the gap: Federal grants; local sources; foundations
Marketing & Public Outreach • Hamburg Rail Days • MI Association of Rail Passengers • UM SMART/ULI Conference • AA Chamber Leadership Team • Chilson Hills Green Expo • CTN Interview • Brighton Rotary • LivCo Democrats • Howell Rotary • Livingston County Planning Commission • Ann Arbor Township Board • EMU Elderwise Council • Superior Township Board • Hamburg Township Board • Michigan Municipal League • St Joseph Mercy Health Systems • Milan landowner/developer • Ann Arbor Spark • Menlo Associates • Livingston County Economic Summit • …and many more Invitations now being accepted!
Awareness of the WALLY Project Livingston County Washtenaw County Have you heard of the transportation project called WALLY, the commuter rail service proposed between Howell and Ann Arbor? 63% 50% AWARE AWARE SOURCE: Survey of 100 Washtenaw Co and 100 Livingston Co residents, conducted June, 2009 for AATA by Ilium of Bellevue, WA
Support for the WALLY Project WALLY is a proposed passenger train service that would operate on existing railroad tracks between Howell and Ann Arbor. There would be stations located in Howell, Genoa Township, Hamburg, Whitmore Lake and Ann Arbor. Trains would operate during commute hours. Please tell me if you Strongly Approve, Approve, Disapprove or Strongly Disapprove of the development of this new service? Livingston County Washtenaw County 80% 75% APPROVE APPROVE (43% STRONGLY APPROVE) (32% STRONGLY APPROVE) SOURCE: Survey of 100 Washtenaw Co and 100 Livingston Co residents, conducted June, 2009 for AATA by Ilium of Bellevue, WA
Likely to Ride WALLY Imagine you worked or traveled regularly to Washtenaw County, how likely would you be to consider riding the WALLY service? Livingston County 71% LIKELY (43% VERY LIKELY) SOURCE: Survey of 100 Livingston Co residents, conducted June, 2009 for AATA by Ilium of Bellevue, WA
Opening Day • Mainly dependent on funding • Stations • Ongoing operations • Repeat: Dependent on funding
Predicted WALLY ridership is 1300 / day, mainly from Livingston County. Is it realistic to expect 13% of these trips to use WALLY?
Outlying NE Illinois Counties Rail Work Trips to Downtown Chicago McHenry Lake Kane DuPage Will
UM Employees Living Near a WALLY Station: Hamburg / Whitmore Lake
New Commuter Rail in the US • 16 new starts since 1983 • Average Length of Planning Period = 10.6 Years • Forecast ridership versus actual • Equal or exceeds forecast = 4 • Short of forecast = 3 • Too soon to tell = 3 (less than 3 years in service) • No comparison available = 6 • Mainly 2010 data – to be updated soon
How does Wally forecast ridership compare to existing commuter rail operations? SOURCE: APTA 2009 PUBLIC TRANSPORTATION FACT BOOK; 60th Edition; April, 2009
Learn More About WALLY • Brochures / Project Maps • Frequently Asked Questions • http://www.wallyrail.org
Get involved with WALLY • Twitter: http://twitter.com/WALLYRail • Facebook: http://www.facebook.com/WALLYRail • Email: WALLY@TheRide.org • Present the “WALLY Road Show” • Traveling display • Or contact Michael Benham: 734-973-1851, mbenham@TheRide.org
RETURN Job Creation • Construction • 775 jobs • Car rehabilitation, ROW Improvements, Station & Parking Construction • A&E firms • Construction firms • Suppliers • Permanent • 290 jobs • Rail operations • Rail maintenance • Suppliers • GLCRR - Buy Michigan! Job Impacts of Spending on Public Transportation: An Update; Prepared for APTA by the Economic Development Research Group, Inc.; April 29, 2009
RETURN Impact on Property Values ● A study of “gentrification” in Chicago, which looked at the value of residential property served by either CTA (Heavy Rail) or Metra (commuter rail), states that “evidence is found that properties closest to transit stations increased in value much more than those farther away, especially in the period 1985-1991. Properties adjacent to transit stations had a 20% higher increase in value compared to those located a half-mile away . . .”46 ● A look at the impact of San Francisco’s BART Heavy Rail system on residential property values found that “the average Alameda County home is worth about $3,700 less for each mile distant from a BART station. The average Contra Coast County home is worth about $3,200 less for each mile distant from a BART station.”47 ● “A 1993 study of the Eastside Metropolitan Area Express (MAX) light rail transit line reviewed the impacts of rail transit to property values in suburban Portland . . . Portland’s experience is generally consistent with the results of the studies in other areas. Within the 2 years after the 1986 beginning of the operation of the rail line, residential properties in the East Burnside area within 500 meters of the transit were, on average, 10.6% greater in value than homes outside 500 meters.”48 ● A study of properties served by Dallas’s new DART Light Rail system found that “The largest increase in residential property values was seen at the VA Hospital station, where values rose 65 percent.”49 ● In Massachusetts, “An analysis of the data shows that the median price of single-family homes nearly doubled in 19 communities after they gained MBTA [commuter rail] service. Brockton, for example, which got three commuter rail stops, had one of the biggest increases in median family-home price: from $71,503 in 1995 to $194,000 in 2002 – up 171 percent.”50 ● According to the Los Angeles Times, “In less than a decade, ‘you could see 5% to 10% premiums,’ said Larry Kosmont, a Los Angeles-based real estate consultant. ‘If you have access to transportation, it is considered a benefit.’”51 20% $3,200 10.6% 65% Doubled 5% - 10% SOURCE: “How Transit Benefits People Who Do Not Ride It: A Conservative Inquiry”; Paul M. Weyrich and William S. Lind; The Free Congress Foundation; October 2003
RETURN Transit Impact on Property Values (cont’d) • A statistical study of residential property values in Buffalo, NY, examined how values varied for properties within one-half mile of light rail transit stations. It found that every foot closer to a light rail station increased average property values by $2.31 (using geographical straight-line distance) and $0.99 (using network distance). Consequently, a home located within one-quarter of a mile radius of a light rail station can earn a premium of $1300-$3000 (Hess, 2007). • Studies over two decades show average housing value premiums associated with being near a station (usually expressed as being within 1⁄4 to 1⁄2 mile of a station) are 6.4% in Philadelphia, 6.7% in Boston, 10.6% in Portland, 17% in San Diego, 20% in Chicago, 24% in Dallas, and 45% in Santa Clara County (Cervero et al, 2004). • A study of experiences in the San Francisco Bay Area study found that for every meter closer a single-family home was to a BART station, its sales price increased by $2.29, all else being equal. Alameda County homes near BART stations sold, on average, for 39% more than otherwise comparable ones 20 miles from the nearest station (Cervero et al, 2004). • A detailed study conducted by researchers at the University of Toronto in 2000 indicated that proximity to a subway station in Toronto generated approximately $4,000 in additional residential property value for a home with a value of $225,000. (Canadian Transit Association, 2003) • A study of the DART system compared differences in land values of “comparable” retail and office properties near and not near light trail stations. The average change in land values from 1997 to 2001 for retail and residential properties near DART stops was 25% and 32%, respectively; for “control” parcels, the average changes were 12% and 20% (Weinstein and Clower, 2003). $2.31 per foot 6.4% to 45% $2.29 per meter $4000 25%, 32% SOURCE: Economic Impact of Public Transportation Investment; Transit Cooperative Research Program (TCRP) Project J-11, Task 7; by Economic Development Research Group and Cambridge Systematics; October 2009
WALLY Planning OrganizationRoles and Responsibilities WALLY Executive Committee • Governance Planning • Financial Planning • Government Relations • Issue Resolution Ann Arbor Transportation Authority WALLY Coalition • Guides and informs creation of the WALLY Business Plan • Mobilizes public support • Facilitates Coalition activities • Working with MDOT staff, provides technical support and tools to the Coalition, its Steering Committee and its Subcommittees, and to the Executive Committee • Creates and executes the WALLY Business Plan, in cooperation w/ MDOT and local communities. • Supports funding efforts and governance initiatives as directed by the Executive Committee WALLY Coalition Steering Committee • Guides activities of the Coalition Subcommittees • Organizes Coalition Meetings • Co-chairs and AATA are official ‘spokespersons’ Stations & Community Development Subcommittee Marketing & PR Subcommittee Infrastructure &Operations Subcommittee • Station design standards • Station site evaluation • Station operating agreements • Transit Oriented Development • Reviews marketing and PR materials and programs • Public education events and presentation • Determine ROW improvement needs • Schedules • Fare Collection • Rolling stock Additional ad hoc subcommittees to be created as needed
RETURN Stimulus for Economic Development