Download
1 / 44
440 likes | 540 Views
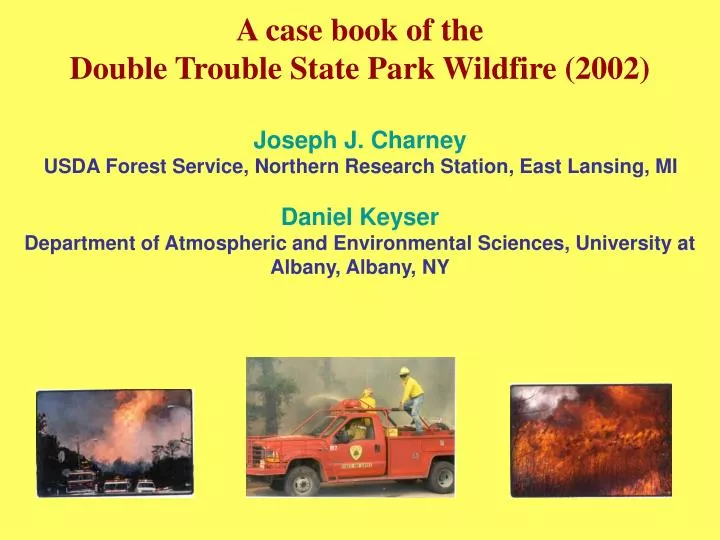
A case book of the Double Trouble State Park Wildfire (2002) Joseph J. Charney USDA Forest Service, Northern Research Station, East Lansing, MI Daniel Keyser Department of Atmospheric and Environmental Sciences, University at Albany, Albany, NY. DTSP wildfire case study.

E N D
A case book of the Double Trouble State Park Wildfire (2002) Joseph J. Charney USDA Forest Service, Northern Research Station, East Lansing, MI Daniel Keyser Department of Atmospheric and Environmental Sciences, University at Albany, Albany, NY
DTSP wildfire case study • DTSP wildfire event • Occurred on 2 June 2002 in east-central NJ • An abandoned campfire grew into a major wildfire by 1800 UTC • Burned 1,300 acres • Forced closure of the Garden State Parkway • Damaged or destroyed 36 homes and outbuildings • Directly threatened over 200 homes • Forced evacuation of 500 homes • Caused ~$400,000 in property damage
DTSP wildfire event New Brunswick wind profiler OKX upper air station KWRI surface station Fire location
Table 1. Sequence of events during the Double Trouble State Park wildfire from 1415 UTC to 2148 UTC 2 June 2002 [adapted from NJFFS (2003)]
Fig. 3. Surface analyses of potential temperature (contour interval 4°C, solid), mixing ratio (value indicated in g kg−1 at station location; contour interval 5 g kg−1, dashed, shaded as indicated in legend), and wind (full barb 5 m s−1) valid at (a) 1200 UTC 2 June 2002, (b) 1800 UTC 2 June 2002, and (c) 0000 UTC 3 June 2002. Adapted from surface analyses generated and archived in the Department of Atmospheric and Environmental Sciences, University at Albany, State University of New York.
Fig. 4. NARR upper-air analyses of (a) geopotential height (contour interval 30 m, solid), temperature (°C, color shaded as indicated in legend), and wind (maximum vector 25 m sP−1P) at 1200 UTC 2 June 2002 at 850 hPa, (b) geopotential height (contour interval 120 m, solid), wind speed (m sP−1P, color shaded as indicated in legend), and wind (maximum vector 75 m sP−1P) at 1200 UTC 2 June 2002 at 300 hPa, (c) as in (a) except for 0000 UTC 3 June 2002, and (d) as in (b) except for 0000 UTC 3 June 2002.
Fig. 6. Skew T–log p soundings at Upton, NY (OKX), valid at (a) 1200 UTC 2 June 2002 and (b) 0000 UTC 3 June 2002. Adapted from the University of Wyoming weather web page (TUhttp://weather.uwyo.edu/upperair/sounding.htmlUT).
DTSP wildfire observations Observed skew T–log p sounding at Upton, NY (OKX), valid at 0000 UTC 3 June 2002
DTSP wildfire observations Wind profiler observations at New Brunswick, NJ, from 1100 UTC to 2100 UTC 2 June 2002
Fig. 8. Surface meteograms from 0000 UTC to 2300 UTC 2 June 2002 for (a) McGuire Air Force Base, NJ (WRI), and (b) Atlantic City, NJ (ACY). Adapted from the Plymouth State Weather Center web page (TUhttp://vortex.plymouth.edu/statlog-u.htmlUT).
Fig. 12. Northwest–southeast-oriented vertical cross section of simulated relative humidity (%, color shaded as indicated in legend) and pressure-coordinate vertical velocity (contour interval 10 dPa s−1, solid, starting at 10 dPa s−1) valid at (a) 1500 UTC 2 June 2002, (b) 1600 UTC 2 June 2002, (c) 1700 UTC 2 June 2002, and (d) 1800 UTC 2 June 2002. The fire location is indicated by the fire icon at 208 km on the abscissa of the cross section. The location of the cross section is indicated by the thick black line in Fig. 10.
Fig. 13. Time series at the fire location valid from 1200 UTC 2 June 2002 to 0000 UTC 3 June 2002 of simulated (a) surface relative humidity (%), (b) surface wind speed (m sP−1P), and (c) PBL depth (m). The fire location is indicated by the fire icon in Fig. 10.
Fig. 14. Time–height cross section at the fire location valid from 1200 UTC 2 June 2002 to 0000 UTC 3 June 2002 of simulated (a) relative humidity (%, color shaded as indicated in legend) and (b) wind speed (m sP−1P, color shaded as indicated in legend). The fire location is indicated by the fire icon in Fig. 10.
Fig. 10. Simulated relative humidity (%, color shaded as indicated in legend) at 700 hPa valid at 1800 UTC 2 June 2002. The fire icon indicates the fire location and the thick black line shows the orientation of the vertical cross section in Fig. 12. Fig. 9. Simulated surface relative humidity (%, color shaded as indicated in legend) and surface wind (full barb 5 m sP−1P) valid at 1800 UTC 2 June 2002.
DTSP wildfire simulations WRF simulations initialized at 1200 UTC 1 June 2002 MRF Simulated skew T–log p sounding at OKX valid at 0000 UTC 3 June 2002
DTSP wildfire simulations YSU Simulated skew T–log p sounding at OKX valid at 0000 UTC 3 June 2002
DTSP wildfire simulations MYJ Simulated skew T–log p sounding at OKX valid at 0000 UTC 3 June 2002
DTSP wildfire simulations MYNN Simulated skew T–log p sounding at OKX valid at 0000 UTC 3 June 2002
DTSP wildfire simulations MRF Simulated skew T–log p sounding at the fire location valid at 1800 UTC 2 June 2002
DTSP wildfire simulations YSU Simulated skew T–log p sounding at the fire location valid at 1800 UTC 2 June 2002
DTSP wildfire simulations MYJ Simulated skew T–log p sounding at the fire location valid at 1800 UTC 2 June 2002
DTSP wildfire simulations MYNN Simulated skew T–log p sounding at the fire location valid at 1800 UTC 2 June 2002
DTSP wildfire simulations Time series at fire location valid from 1200 UTC to 2100 UTC 2 June 2002 of simulated surface temperature
DTSP wildfire simulations Time series at fire location valid from 1200 UTC to 2100 UTC 2 June 2002 of simulated surface mixing ratio
DTSP wildfire simulations Time series at fire location valid from 1200 UTC to 2100 UTC 2 June 2002 of simulated surface wind speed
DTSP wildfire simulations Vertical profiles at fire location valid from 1200 UTC to 2100 UTC 2 June 2002 of simulated temperature
DTSP wildfire simulations Vertical profiles at fire location valid from 1200 UTC to 2100 UTC 2 June 2002 of simulated temperature
DTSP wildfire simulations Vertical profiles at fire location valid from 1200 UTC to 2100 UTC 2 June 2002 of simulated temperature
DTSP wildfire simulations Vertical profiles at fire location valid from 1200 UTC to 2100 UTC 2 June 2002 of simulated temperature
DTSP wildfire simulations Vertical profiles at fire location valid from 1200 UTC to 2100 UTC 2 June 2002 of simulated mixing ratio
DTSP wildfire simulations Vertical profiles at fire location valid from 1200 UTC to 2100 UTC 2 June 2002 of simulated mixing ratio
DTSP wildfire simulations Vertical profiles at fire location valid from 1200 UTC to 2100 UTC 2 June 2002 of simulated mixing ratio
DTSP wildfire simulations Vertical profiles at fire location valid from 1200 UTC to 2100 UTC 2 June 2002 of simulated mixing ratio
DTSP wildfire simulations Vertical profiles at fire location valid from 1200 UTC to 2100 UTC 2 June 2002 of simulated wind speed
DTSP wildfire simulations Vertical profiles at fire location valid from 1200 UTC to 2100 UTC 2 June 2002 of simulated wind speed
DTSP wildfire simulations Vertical profiles at fire location valid from 1200 UTC to 2100 UTC 2 June 2002 of simulated wind speed
DTSP wildfire simulations Vertical profiles at fire location valid from 1200 UTC to 2100 UTC 2 June 2002 of simulated wind speed
Summary • An intercomparison of the MRF, YSU, MYJ, and MYNN PBL schemes in WRF version 3.1 for the DTSP wildfire event indicates that the behavior of these schemes is consistent with that documented in the literature. • The MRF and YSU schemes produce less directional wind shear than the MYJ and MYNN schemes. • The diurnal growth of the mixed layer is more gradual in the YSU, MYJ, and MYNN schemes than in the MRF scheme. • The YSU and MYNN PBL schemes exhibit a deeper mixed layer than the MYJ scheme.
Future work • The methodology developed for the DTSP wildfire event will be extended to additional events. • Candidates include the Warren Grove (NJ, 2007), Evans Road (NC, 2008), and Cottonville (WI, 2005) wildfires. • Aspects to be examined for these events: 1) effects of the entrainment formulation on mixed-layer growth 2) sensitivity of mixing ratio profiles in the mixed layer to the choice of PBL scheme 3) performance of the PBL schemes in high-wind regimes