Download
1 / 17
170 likes | 384 Views
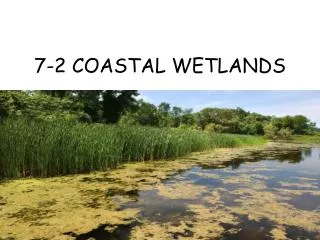
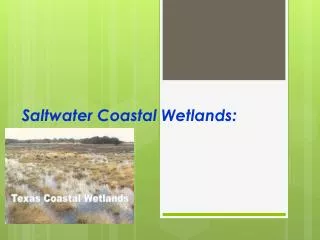
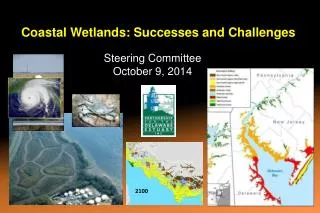
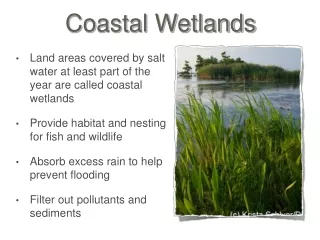
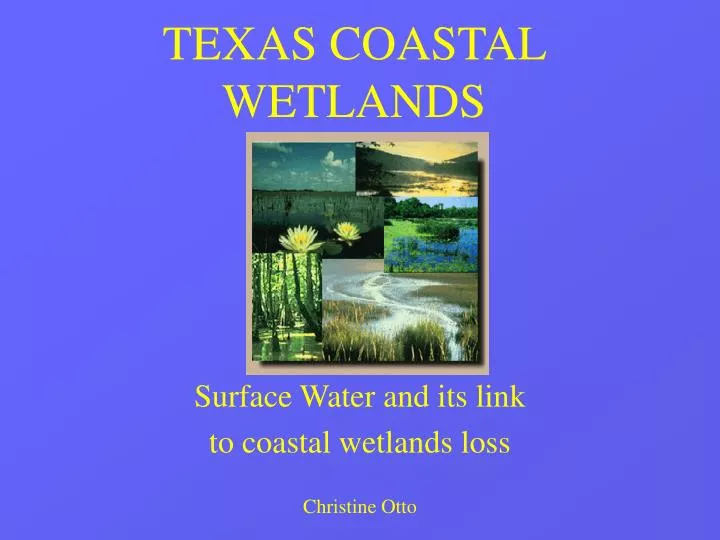
TEXAS COASTAL WETLANDS. Surface Water and its link to coastal wetlands loss Christine Otto. BACKGROUND. Texas wetlands 7.6 million acres of wetlands in Texas Between mid 1950’s and 1979, 35% loss Link of wetland loss to population growth and density

E N D
TEXAS COASTAL WETLANDS Surface Water and its link to coastal wetlands loss Christine Otto
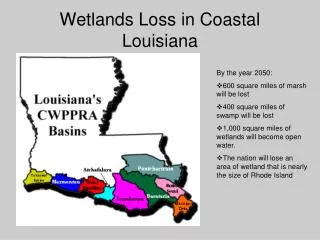
BACKGROUND • Texas wetlands • 7.6 million acres of wetlands in Texas • Between mid 1950’s and 1979, 35% loss • Link of wetland loss to population growth and density • Between 1960 and 1990, population along coast more than doubled • 187 persons/mile squared
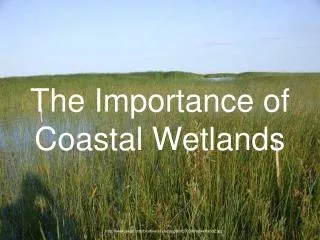
URBAN DEVELOPMENT Alteration of wetland hydrology, topography, and vegetation
URBANIZATION RUNOFF (more and faster) EROSION INCREASED IMPERVIOUS SURFACE DECREASE GW RECHARGE REDUCED FLOWS IN WETLANDS
OBJECTIVE • Incorporate the use of GIS in an analysis of the wetland loss along the Texas Coast • Determine if a correlation exists between the decline in wetlands and the urban growth in the Texas Coastal Area
DATA SOURCES • Texas WetNet (General Land Office): Wetland Files, Texas Coastal Boundary • Dr. David Maidment’s CE394K.3 class folder: • huc12 - polygon theme of Hydrologic Cataloging Units for Region 12 of the US • rf1huc12 - EPA River Reach files for Region 12 • Texasppt - grid of mean and annual precipitation over Texas (mm) • Texas USGS database: Texas Discharge Data • ESRI: Urban development along coast
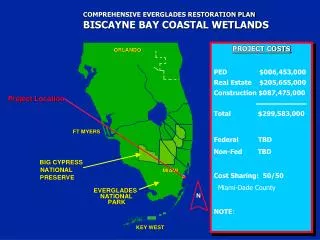
METHODOLOGY • Classify huc12.shp theme based on HUC codes (4 subbasins) 120402 120904 121004 121102
METHODOLOGY • Classify huc12.shp theme based on HUC codes (4 subbasins) • Selected features of other themes within area of extent
METHODOLOGY • Classify huc12.shp theme based on HUC codes (4 subbasins) • Selected features of other themes within area of extent • Calculate Precipitation, Runoff, and Flow Grids
METHODOLOGY: Precipitation Balance of I and O = water budget Natural Water Level Fluctuations Hydroperiod
METHODOLOGY: Runoff R (mm/yr) = 0.51 * P (mm/yr) - 339 Change in water levels Wetland Response Time Change in detention time
METHODOLOGY • Classify huc12.shp theme based on HUC codes (4 subbasins) • Selected features of other themes within area of extent • Calculate Precipitation, Runoff, and Flow Grids • Discharge Data compiled and graphed
FLOW 90% loss Submerged marine grasses in Galveston
9,563 acres lost along upper coast AREA OF INTEREST
TIDAL INFLUENCES Salt water intrusion Erosion
CONCLUSION • Correlation between urban growth and wetlands loss along Texas Coastal Boundary • Too early to determine long-term impacts • Many factors affecting loss; difficult to delineate exact causes
FUTURE WORK • Determine areas of loss versus areas of conversion • Compare data found with USGS and Texas General Land Office’s findings • EPA’s Dallas Office: Trinity River Basin and Galveston Bay