Download
1 / 31
310 likes | 483 Views
Review For Quiz on Pie Charts. Constructing Pie Charts Deconstructing Pie Charts Select Vocabulary from Surveys & Variables. What is a Pie Chart?. A pie chart or __________________________ ______________________________________ ______________________________________

E N D
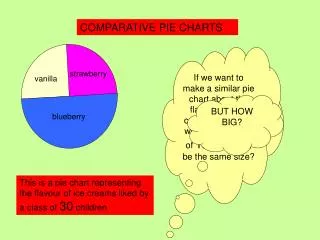
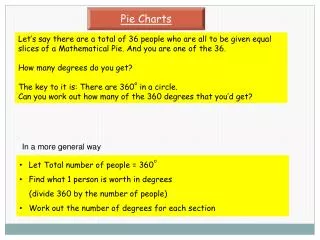
Review For Quiz on Pie Charts Constructing Pie Charts Deconstructing Pie Charts Select Vocabulary from Surveys & Variables
What is a Pie Chart? A pie chart or __________________________ ______________________________________ ______________________________________ What is another name for a Pie Chart? _____________________________________
What is a Pie Chart? A pie chart or circle graph has sectors that visually display proportional parts of a total set of data that share a common variable Another name: Circle Graph
4 Pie Chart Characteristics • Help________________________________ ___________________________________. • Help _________________________________ ____________________________________. • Especially useful _____________________. • Most effective when ____________________ ____________________________________.
4 Pie Chart Characteristics • Help an audience understand distribution of data quickly and easily. • Help to see how a total is divided into categories • Especially useful with categorical data • Most effective when the number of segments is 10 or fewer
Reviewing Variable Types • __________ (or __________) • __________ (or __________)
Variable Vocabulary:Variables Come in 2 Varieties • Categorical (or Qualitative) • Quantitative (or Numerical)
Reviewing _________ Variables. 6 Characteristics • Recorded usually _________________ • Records which of several ___________ _____________ belongs to • Count data in each ________, but ______________ should not ________ it • Can calculate ____________________ • Includes all _____________________ • Graphing:______________________
Categorical Variables • Recorded usually with words • Records which of several groups an individual belongs to • Count data in each group, but you logically should not average it • Can calculate %age distributions • Includes all yes/no questions • Graphing: best illustrated with a pie chart
2 Types of Quantitative Variables • __________ If the Q variable is a set of isolated points on the number line, we call it this. (i.e., it’s a number but it only comes in certain values). Can be counted • __________ If the Q variable forms an entire interval along the number line, we call it this. (i.e., it’s a number & it can be any value). Can be measured
2 Types of Quantitative Variables • Discrete If the Q variable is a set Quantitative of isolated points on the number line, we call it this. (i.e., it’s a number but it only comes in certain values). Can be counted • Continuous If the Q variable forms an entire Quantitative interval along the number line, we Variable call it this. (i.e., it’s a number & it can be any value). Can be measured Variable
Vocabulary from Surveys • Define a Population in a statistical sense: _______________________________ • Define Data in a statistical sense: ________________________________
Vocabulary from Surveys 1. Define a Population in a statistical sense: A population is an entire collection of individuals or objects about which information is desired. 2. Define Data in a statistical sense Data are numbers collected in a particular context. During a survey, the interviewer collects it. It always has units.
Vocabulary from Surveys • What is good data? _______________________________ • What is bad data? ________________________________
Vocabulary from Surveys 1. Good Data in a statistical sense Good Data is the result of intelligent effort and good random sampling methods. 2. Bad Data in a statistical sense Bad Data are the result of laziness, lack of understanding, the desire to mislead others or bad sampling methods.
Classwork & Homework • Use the terms you’ve learned to deconstruct pie charts • Answer some the ‘usual’ questions about the nature of the survey using the data and your powers of analysis.
Answering ?s About Profs • What is question to answer? • What is the population? • Describe the sample: numbers, units other description • Variables? Q or C? • Units or 2 categories • Conclusions?
Answering ?s About Profs • What is question to answer? • In teaching • What is the population? • Typical college professors • Describe the sample: numbers, units other description • ‘an average’ college professor • Variables? Q or C? • Time; Categorical • Units or 2 categories • Teaching, consulting, research, growth, comm serv, etc • Conclusions? • Most time is spent in teaching
Broadband Market Share
What you need: Graphing Calculator Protractor Compass Pencil Eraser HW to the HW Box How you take test: Answer Vocabulary Then do #2 Deconstruction Then do #1 Construction of graph WATCH THE TIME— This test is longer Quiz #102 Test Taking Strategies