Download
1 / 12
120 likes | 192 Views
EFFAS Stockholm June 2009 Con Keating. Central Banking.

E N D
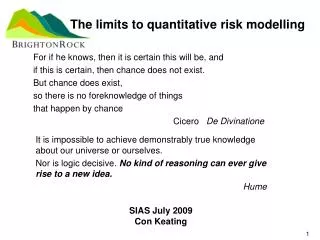
EFFASStockholm June 2009Con Keating Central Banking The vast and complex structure of modern banking and credit systems is one of extreme delicacy of balance and adjustments, and it must never be overlooked that it is highly sensitive to all manner of disturbances, as recent events have painfully demonstrated. The banking systems are closely related to one another, and financial distress or collapse at one point quickly transmits shock to all others. First Annual Report of the Federal Reserve Board For the period ended December 31, 1914 1
Some preliminaries • 12 Fed Banks – Each owned by member commercial banks • 6% of their capital and reserves- half paid-in • Pays 6% annual dividend on paid-in capital • Maintain a surplus account equal to paid-in • Everything in excess of this gets paid to UST • Interest on Federal Reserve Notes – Seigneurage • Since WWII banknotes have driven the size of the Fed’s Balance Sheet – increasingly so.. • Until the recent changes the FED balance sheet was around 6% of GDP, • But had been far higher historically and was 14% in 1951 • The active parts from Volcker forward were “liquidity providing repos” and “bank deposits”
Monetary policy • FOMC set the operational target (unsecured overnight rate at which banks lend and borrow) – the fed funds rate • System open market account ensures reserves are supplied to achieve rate. • Daily repos – targeted at forecast reserves • Occasion outright purchases of UST (to supply currency) • Average stock of monetary policy instruments in 2006 $25.3 billion • Outright purchases of securities in 2006 $34.2 billion • In 2006 average deviation from target was just 3 bps • Active policy instruments averaged 0.5% of GDP until 2008 when they become almost 12%
Bank Reserves • Payments system efficiency • Since 1951 actual reserves have held in the range $18 - $30 billion • Excess reserves 2007 - $1.8 billion – now $798 billion • Liquidity ratios – ratio of total assets to UST & Agencies • 1951 – 2x 1961 – 3.1x 1971 – 6x 1981- 8.2x • 2006 – 8x 2007 – 9.4x • Most credit growth wasn’t in the banks!!! • Overall market liquidity leverage 1951 5x 2007 45x • GSE growth 1951 – 1% GDP 1981 - 10% GDP • 2006 – 81% GDP
Fed Assets • Now amount to 12% of bank assets • Only 20% are UST & Agency – first decline since 1989 • 1951 – 50% 1971 – 70% 2001- 85% • Sales were sterilisation of liquidity facilities • And UST issued $560 billion of CMBs – supplementary financial programme • Supposed to cease by mid August • If you are looking at other central banks this may be material! • Positive curve and carry also helped • A question – has the UST acquired monetary policy power in this? • See Joint Statement March 23 2009 • FED and interest on reserves..
Liquidity Overseas • Foreign Exchange Swaps • Unlimited with ECB, BoJ, Bank of England, SNB • Drawn ECB $291 BoJ $123 BoE $33.1 SNB $25.2 • And then all the new facilities etc… • Maiden Lane - I Bear Stearns II & III AIG These will be going to UST (presumably at acquisition cost)
FRA • FRA requires shareholders to cover liabilities of their FRB • But not other FRBs • And UST is only liable for the FR Notes • And collectivism may not hold • In 1934 FRB Chicago refused to purchase securities from FRB NY. • FRB NY is 73% of risk assets
Other loans £194 billionFacilities and Contingencies… • Term Auction Credit (TAF) - $94 billion • Very similar to discount window borrowing –same collateral but auction priced and 28 or 84 day terms • Collateral subject to haircut, other recourse • Commercial Paper Funding Facility (CPFF) and, and • - $37 billion PDCF - $24 billion AMLF - AIG $37 billion • Contingent Credit • Citi - $244.8 BoA $100 AIG 23.2 • Maiden Lane incidentally is a loss of $74.3 billion • TARP guarantees first 10% of TALF - ??500 billion??
Income and other value • FRB earnings - $50 billion • Gold revaluation $240 billion? • Mark to Market on Open Market Account $60 billion?
The question • How do we reverse out of this?? • Without unprecedented inflation?