Download
1 / 30
300 likes | 418 Views
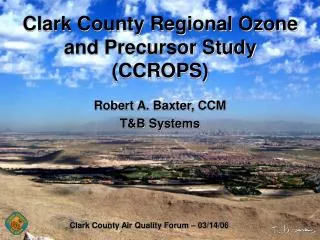
Clark County PM 10 Saturation Study. Robert A. Baxter, CCM T&B Systems. Clark County Air Quality Forum – 03/14/06. Overview. Objectives of the Study Selection of PM 10 Measurement Methods Saturation Sampling Network Quality Assurance of Measurements Saturation Study Observations

E N D
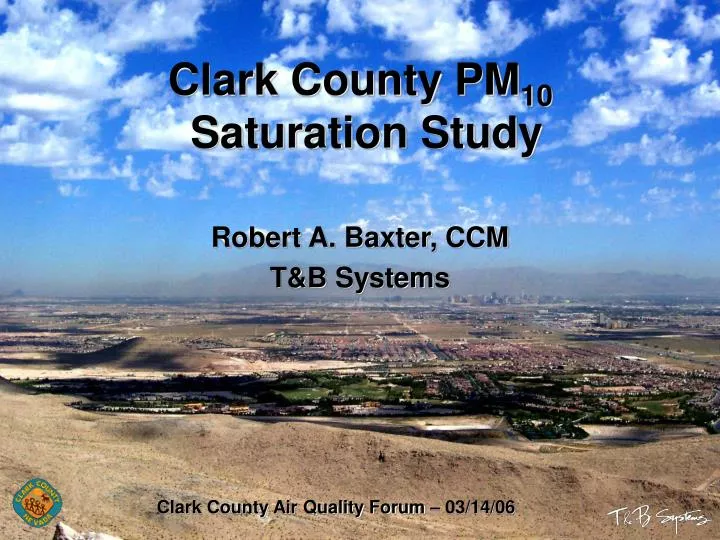
Clark County PM10 Saturation Study Robert A. Baxter, CCM T&B Systems Clark County Air Quality Forum – 03/14/06
Overview • Objectives of the Study • Selection of PM10 Measurement Methods • Saturation Sampling Network • Quality Assurance of Measurements • Saturation Study Observations • Overall Results and Recommendations
Objectives State Implementation Plan committed to a PM10 saturation study • Assess the representativeness of the current monitoring network • Determine the inter-basin and intra-basin transport during high wind speed events • Determine the neighborhood impacts of major sources in the region
Evaluation Criteria Continuous Method Acceptable performance No environmental controls Solar power Inconspicuous Cost-effective Reliable Two evaluation sites Crustal PM10 Combustion emissions related PM10 Evaluated Instruments Met One E-Sampler R&P Dustscan TSI DustTrak Measurement Methods
Sampler Evaluation October/November 2004 Joe Neal Non-urban
Sampler Evaluation October/November 2004 City Center Urbanized
TSI DustTrak External data logging Extended sample inlet Solar/available power Sampler EvaluationSelected Instrumentation
Quality Assurance • Three scheduled audits • Evaluation study • Saturation study • Data processing and validation • Routine quality control checks • DustTrak flow and zero • Power system checks • Download and review of data • Quality Control site – Joe Neal
Saturation Study Observations • Historical observations • Observed climatology and meteorology • Saturation network versus DAQEM network comparisons • High wind speed events
Historical Observations 9 4 3 11 4 2 1 # of Exceedances
Historical Observations Effect of wind speed on exceedance values2000 – 2003 data
Study Observations May 16 June 17 Fires May 29 May 9 24-hour average DAQEM network PM10
Study Observations Fires May 29 May 16 June 17 May 9 24-hour average saturation network PM10
High Wind Speed Events June 17 May 16 May 9 May 29 Fires 24-hour average wind speed
High Wind Speed Events Hourly saturation network PM10 values
High Wind Speed Events Hourly saturation network PM10 values
Study ResultsAdequacy of DAQEM Network Concentration distributions for “high-PM days” were evaluated • 24-hour average PM10 levels relatively low • High wind speed events could have produced exceedances in prior dry years • DAQEM network reflected observed patterns in the historical analysis • Saturation network saw similar patterns but added higher values in the south
Network ObservationsMay 29, 2005 DAQEM Saturation
Network Observations June 17, 2005 DAQEM Saturation
Study ResultsTransport During High Wind Events • Four high wind speed events • High wind speed events could have produced exceedances in prior dry years • June 17 event reflected southwest to northeast axis with apparent transport
Composite June 17, 2005 Saturation and DAQEM Networks
Study ResultsNeighborhood Impacts • Two sites adjacent to major sources • West side near quarry – Mountain Crest • Northeast side near quarry – Speedway • Influence of the sources could be seen at the adjacent sites in stable conditions (10-20 ug/m3) • Source contribution in high wind speeds will be related to the source mitigation efforts
Study Average PM10 by Hour Wetlands Blue Diamond Mountain Crest
Summary • Additional site in the south for inflow and observations during high wind speed events • Review the status of the west side sites • ~15 mph wind speeds needed for entrainment • Material handling added 10 to 20 ug/m3 to regions adjacent to quarry sites • Optical method worked well but with some limitations • Observed PM10 higher values were short lived due to limited PM reservoir • Field observations of dust mitigation appeared very effective in reducing visible emissions
Questions? Please contact: Department of Air Quality and Environmental Management (DAQEM) (702) 455-5942