Download
1 / 34
340 likes | 405 Views
MAT271E - Probability and Statistics

E N D
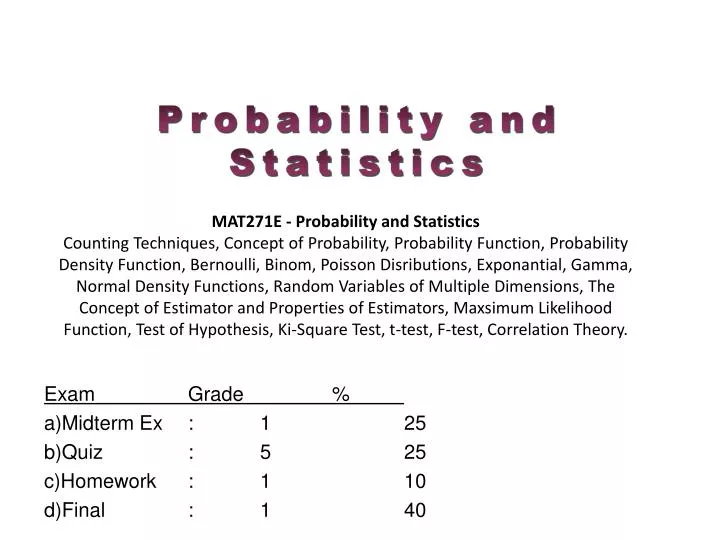
MAT271E - Probability and Statistics Counting Techniques, Concept of Probability, Probability Function, Probability Density Function, Bernoulli, Binom, Poisson Disributions, Exponantial, Gamma, Normal Density Functions, Random Variables of Multiple Dimensions, The Concept of Estimator and Properties of Estimators, Maxsimum Likelihood Function, Test of Hypothesis, Ki-Square Test, t-test, F-test, Correlation Theory. Exam Grade % • Midterm Ex : 1 25 • Quiz : 5 25 • Homework : 1 10 • Final : 1 40
Terminology: • Trial: each time you repeat an experiment • Outcome: result of an experiment • Random experiment: one with random outcomes (cannot be predicted exactly) • Relative frequency: how many times a specific outcome occurs within the entire experiment. • Sample space: the set of all possible outcomes of an experiment • Event: any subset of the sample space
In a number of different situations, it is not easy to determine the outcomes of an event by counting them individually. Alternatively, counting techniques that involve permutations And combinations are helpful when calculating theoretical probabilities.
Counting principle states that"If there aremways to do one thing, andnways to do another, andtways to do a third thing, and so on ..., then the number of ways of doing all those things at once is mxnxt x ... Let's look at an actual example and try to make sense of this rule. How about a license plate ...
How many different license plates are there altogether? Look at what's used to make a plate:LETTER LETTER LETTER NUMBER NUMBER NUMBER For each of the letters we have 26 choices. For each of the numbers we have 10 choices. The Fundamental Counting Principle says that: The total number of ways to fill the six spaces on a licence plate is26x26x26x10x10x10which equals 17,576,000
GZPA74 How could the provinceincreasethe total number of possible license plates? One way would be to make the plates withfour letters and two numbers. Then the total number of plates would be: 26 x 26 x 26 x 26 x 10 x 10 = 45,697,600
Tree Diagrams Tree diagrams are a graphical way of listing all the possible outcomes. The outcomes are listed in an orderly fashion, so listing all of the possible outcomes is easier than just trying to make sure that you have them all listed • When calculating probabilities, you need to know the total number of outcomesin the sample space
H H H T SampleSpace Use a TREE DIAGRAM to list the sample space of 2 coin flips. H T T T H If you got H H Now you could get… T On the first flip you could get….. YOU H T If you got T Now you could get… T T The final outcomes are obtained by following each branch to its conclusion: They are from top to bottom:HH HT TH TT
Multiplication Rule of Counting • The size of the sample space is the denominatorof our probability • So we don’t always need to know what each outcome is, just thenumber of outcomes.
Multiplication Rule of Compound Events If… • X = total number of outcomes for event A • Y = total number of outcomes for event B • Then number of outcomes for A followed by B =x times y
Multiplication Rule:Dress Mr. Arnold • Mr. Reed had 3 EVENTS 2 2 3 pants shirts shoes How many outcomes are there for EACH EVENT? 2(2)(3) = 12 OUTFITS
Sometimes we are concerned with how many ways a group of objects can be arranged • How many ways to arrange books on a shelf • How many ways a group of people can stand in line • How many ways to scramble a word’s letters
If we have n distinct objects and we want to put them in some sort of ordered set (arrangement) we use permutations, denoted or and equal to
denoted with ! • Multiply all integers ≤ the number • 0! = • 1! = • Calculate 6! • What is 6! / 5!? 5! 5! = 5(4)(3)(2)(1) = 120 1 1 6! = 6(5)(4)(3)(2)(1) = 720
denoted with ! • Multiply all integers ≤ the number • 0! = • 1! = • Calculate 6! • What is 6! / 5!? 5! 1 1 =6 6(5)(4)(3)(2)(1) 5(4)(3)(2)(1)
Harder things to count Suppose that we still have n objects in our set but that some of them are indistinguishable from one another (an example of this would be the set of letters in the word “googol”). Suppose that we are interested in using all of the letters for each arrangement but we want to know how many distinguishably different arrangements there can be.
Here we want to use permutations again but we want to divide out those permutations which are not distinguishable from one another by virtue of their containing some of the repeated objects in different locations. Suppose there are p of one object, q of another, etc. Our calculation can be done as
You have • You select • This is the number of ways you could selectand arrangein order: n objects r objects Another common notation for a permutation is nPr
Sometimes, we are only concerned with selectinga group and not the order in which they are selected. • A combinationgives the number of ways to select a sample of r objects from a group of size n.
You have n objects • You want a group of r object • You DON’T CAREwhat order they are selected in Combinations are also denoted nCr Read “n choose r”
Order matters Permutation • Order doesn’t matter Combination
Many things in everyday life, from stock price to lottery, are random phenomena for which the outcome is uncertain. • The concept of probability provides us with the idea on how to measure the chances of possible outcomes. • Probability enables us to quantify uncertainty, which is described in terms of mathematics
what is the chance that a given event will occur? For us, what is the chance that a child, or a family of children, will have a given phenotype? • Probability is expressed in numbers between 0 and 1. Probability = 0 means the event never happens; probability = 1 means it always happens. • The total probability of all possible event always sums to 1. 0⪯P⪯1
The probability of an event equals the number of times it happens divided by the number of opportunities. • These numbers can be determined by experiment or by knowledge of the system. The Number Of Ways Event A Can Occur Probability Of An Event P(A) = ---------------------- The total number Of Possible Outcomes
Four people run in a marathon. In how many ways can first and second place finish? Hasan, Ayşe, Ali, Veli Ayşe Hasan Ali Veli 4.3=12 Outcomes Ayşe Hasan Ali Event 2 occurs 3 ways Veli Hasan Event 1 occurs 4 ways Ali Ayşe Veli Hasan Veli Ayşe Ali
Manipulating Numbers “There are lies, damned lies, and statistics” -- Disraeli
Why use statistics? Anecdotal evidence is unreliable Why does the phone always ring when you’re in the shower?
Why use statistics? Determining the difference between chance and real effects
Signal and Noise Data = Signal + Noise Signal = What we’re trying to measure Noise = Error in our measurement If noise is random, then as the sample size increases, noise tends to cancel, leaving only signal.
Statistics is the area of science that deals with collection, organization, analysis, and interpretation of data. • It also deals with methods and techniques that can be used to draw conclusions about the characteristics of a large number of data points--commonly called a population-- • By using a smaller subset of the entire data.
For Example… • You work in a cell phone factory and are asked to remove cell phones at random off of the assembly line and turn it on and off. • Each time you remove a cell phone and turn it on and off, you are conducting a random experiment. • Each time you pick up a phone is a trial and the result is called an outcome. • If you check 200 phones, and you find 5 bad phones, then • relative frequency of failure = 5/200 = 0.025
Statistics in Engineering • Engineers apply physical and chemical laws and mathematics to design, develop, test, and supervise various products and services. • Engineers perform tests to learn how things behave under stress, and at what point they might fail.
Statistics in Engineering • As engineers perform experiments, they collect data that can be used to explain relationships better and to reveal information about the quality of products and services they provide.