Download
1 / 49
490 likes | 634 Views
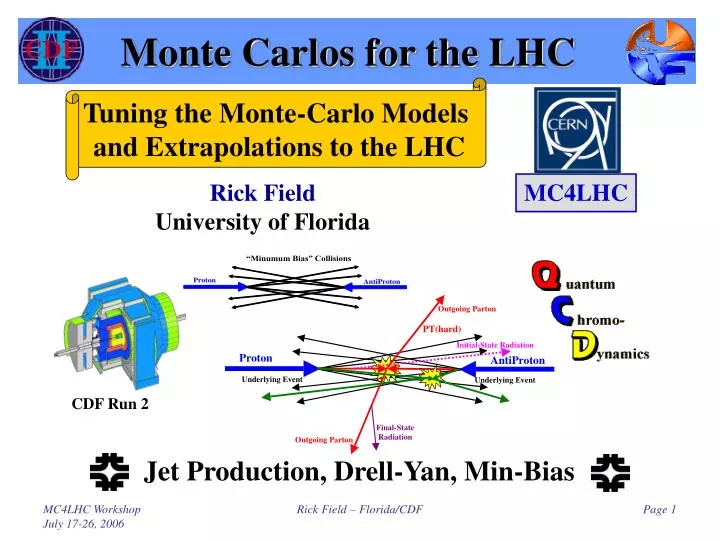
Jet Production, Drell-Yan, Min-Bias. Monte Carlos for the LHC. Tuning the Monte-Carlo Models and Extrapolations to the LHC. Rick Field University of Florida. MC4LHC. CDF Run 2. “Hard Scattering” Component. QCD Monte-Carlo Models: High Transverse Momentum Jets.

E N D
Jet Production, Drell-Yan, Min-Bias Monte Carlos for the LHC Tuning the Monte-Carlo Models and Extrapolations to the LHC Rick Field University of Florida MC4LHC CDF Run 2 Rick Field – Florida/CDF
“Hard Scattering” Component QCD Monte-Carlo Models:High Transverse Momentum Jets • Start with the perturbative 2-to-2 (or sometimes 2-to-3) parton-parton scattering and add initial and final-state gluon radiation (in the leading log approximation or modified leading log approximation). “Underlying Event” • The “underlying event” consists of the “beam-beam remnants” and from particles arising from soft or semi-soft multiple parton interactions (MPI). The “underlying event” is an unavoidable background to most collider observables and having good understand of it leads to more precise collider measurements! • Of course the outgoing colored partons fragment into hadron “jet” and inevitably “underlying event” observables receive contributions from initial and final-state radiation. Rick Field – Florida/CDF
Distribution of Particles in Jets CDF Distribution of Particles in Jets • Momentum distribution of charged hadrons in jets well described by MLLA (A. Kortov and students)! • Dijet mass range 80-600 GeV • Cutoff Qeff = 230 40 MeV • Ncharged-hadrons/Npartons = 0.56 0.10 • Ratio of charged hadron multiplicities in gluon and quark jets agrees with NNLLA • Gluon-Quark Ratio = 1.6 0.2 MLLA Curve! CDF Run 1 Analysis = ln(Ejet/pparticle) Both PYTHIA and HERWIG predict a Gluon-Quark Ratio that is smaller than the data! Ratio = Ng-jet / Nq-jet Q = Ejet qcone Rick Field – Florida/CDF
Charged Multiplicity in Quark and Gluon Jets • CDF Run 1 data on the average charged particle multiplicities in gluon and quark jets versus Q = Ejet× qcone compared with NLLA, PYTHIA, and HERWIG. CDF Run 1 Analysis • HERWIG and PYTHIA correctly predict the charged multiplicity for gluon jets. • Both HERWIG and PYTHIA over-estimate the charged multiplicity in quark jets by ~30%! Rick Field – Florida/CDF
pchg = 2 GeV/c Distribution of Particles in Quark and Gluon Jets • Momentum distribution of charged particles in gluon jets. HERWIG 5.6 predictions are in a good agreement with CDF data. PYTHIA 6.115 produces slightly more particles in the region around the peak of distribution. Both PYTHIA and HERWIG predict more charged particles than the data for quark jets! CDF Run 1 Analysis x = 0.37 0.14 0.05 0.02 0.007 • Momentum distribution of charged particles in quark jets. Both HERWIG and PYTHIA produce more particles in the central region of distribution. Rick Field – Florida/CDF
Evolution of Charged Jets“Underlying Event” Charged Particle Df Correlations PT > 0.5 GeV/c |h| < 1 Look at the charged particle density in the “transverse” region! • Look at charged particle correlations in the azimuthal angle Df relative to the leading charged particle jet. • Define |Df| < 60o as “Toward”, 60o < |Df| < 120o as “Transverse”, and |Df| > 120o as “Away”. • All three regions have the same size in h-f space, DhxDf = 2x120o = 4p/3. “Transverse” region very sensitive to the “underlying event”! CDF Run 1 Analysis Rick Field – Florida/CDF
Run 1 PYTHIA Tune A CDF Default! PYTHIA 6.206 CTEQ5L • Plot shows the “transverse” charged particle density versus PT(chgjet#1) compared to the QCD hard scattering predictions of two tuned versions of PYTHIA 6.206 (CTEQ5L, Set B (PARP(67)=1)andSet A(PARP(67)=4)). Run 1 Analysis Old PYTHIA default (more initial-state radiation) Old PYTHIA default (more initial-state radiation) New PYTHIA default (less initial-state radiation) New PYTHIA default (less initial-state radiation) Rick Field – Florida/CDF
“Transverse” Charged Particle Density “Transverse” region as defined by the leading “charged particle jet” • Shows the data on the average “transverse” charge particle density (|h|<1, pT>0.5 GeV) as a function of the transverse momentum of the leading charged particle jet from Run 1. Excellent agreement between Run 1 and 2! • Compares the Run 2 data (Min-Bias, JET20, JET50, JET70, JET100) with Run 1. The errors on the (uncorrected) Run 2 data include both statistical and correlated systematic uncertainties. PYTHIA Tune A was tuned to fit the “underlying event” in Run I! • Shows the prediction of PYTHIA Tune A at 1.96 TeV after detector simulation (i.e. after CDFSIM). Rick Field – Florida/CDF
Charged Multiplicity in Charged Particle Jets PYTHIA predict more charged particles than the data for charged jets! • Plot shows the average number of charged particles (pT > 0.5 GeV, |h| < 1) within the leading charged particle jet (R = 0.7) as a function of the PT of the leading charged jet. The solid (open) points are Min-Bias (JET20) data. The errors on the (uncorrected) data include both statistical and correlated systematic uncertainties. The QCD “hard scattering” theory curves (Herwig 5.9, Isajet 7.32, Pythia 6.115) are corrected for the track finding efficiency. CDF Run 1 Analysis Includes charged particles from the “underlying event”! Rick Field – Florida/CDF
PYTHIA does not agree at high z! Run 1 Fragmentation Function • CDF Run 1 data from on the momentum distribution of charged particles (pT > 0.5 GeV and |h| < 1) within chgjet#1 (leading charged jet) for PT(chgjet#1) > 5 GeV compared with the QCD “hard scattering” Monte-Carlo predictions of HERWIG, ISAJET, and PYTHIA. The points are the charged number density, F(z) = dNchg/dz, where z = pchg/P(chgjet#1) is the ratio of the charged particle momentum to the charged momentum of chgjet#1. CDF Run 1 Analysis Rick Field – Florida/CDF
PYTHIA does not agree at high z! Run 1 Fragmentation Function • Data from Fig. 3.8 on the momentum distribution of charged particles (pT > 0.5 GeV and |h| < 1) within chgjet#1 (leading charged jet) for PT(chgjet#1) > 30 GeV compared with the QCD “hard scattering” Monte-Carlo predictions of HERWIG, ISAJET, and PYTHIA. The points are the charged number density, F(z) =dNchg/dz, where z = pchg/P(chgjet#1) is the ratio of the charged particle momentum to the charged momentum of chgjet#1. CDF Run 1 Analysis Rick Field – Florida/CDF
Charged Particle kT Distribution in Jets Shape Comparison Only In 1 fb-1 we have thousands of charged tracks with pT > 100 GeV/c! Fragmentation Summary • Neither HERWIG or PYTHIA describe precisely the distribution charged particles in quark and gluon jets at the Tevatron! Was this measured in Run 1? • To learn about the fragmentation function at large z we should compare the inclusive “jet” cross-section to the inclusive charged particle cross section! • We have events with 600 GeV “jets” so we must have events with 300 GeV/c charged particles! • A lot of work has been done in comparing to analytic MLLA calculations (Korytov and students), but more work needs to be done in improving the fragmentation models in HERWIG and PYTHIA! • I wish I could show you the following: • CDF measured fragmentation functions at different Q2 compared with PYTHIA and HERWIG. • The kT distribution of charged particles within “jets” compared with PYTHIA and HERWIG. • The ratio of the inclusive charged particle cross-section to the inclusive “jet” cross-section compared with PYTHIA and HERWIG. Sergo “blessing” this in the QCD group last week! Rick Field – Florida/CDF
The “Transverse” Regionsas defined by the Leading Jet Charged Particle Df Correlations pT > 0.5 GeV/c |h| < 1 Look at the charged particle density in the “transverse” region! • Look at charged particle correlations in the azimuthal angle Df relative to the leading calorimeter jet (JetClu R = 0.7, |h| < 2). • Define |Df| < 60o as “Toward”, 60o < -Df < 120o and 60o < Df < 120o as “Transverse 1” and “Transverse 2”, and |Df| > 120o as “Away”. Each of the two “transverse” regions have area DhDf = 2x60o = 4p/6. The overall “transverse” region is the sum of the two transverse regions (DhDf = 2x120o = 4p/3). “Transverse” region is very sensitive to the “underlying event”! Rick Field – Florida/CDF
Charged Particle Density Df Dependence Refer to this as a “Leading Jet” event • Look at the “transverse” region as defined by the leading jet (JetClu R = 0.7, |h| < 2) or by the leading two jets (JetClu R = 0.7, |h| < 2). “Back-to-Back” events are selected to have at least two jets with Jet#1 and Jet#2 nearly “back-to-back” (Df12 > 150o) with almost equal transverse energies (ET(jet#2)/ET(jet#1) > 0.8) and with ET(jet#3) < 15 GeV. Subset Refer to this as a “Back-to-Back” event • Shows the Df dependence of the charged particle density, dNchg/dhdf, for charged particles in the range pT > 0.5 GeV/c and |h| < 1 relative to jet#1 (rotated to 270o) for 30 < ET(jet#1) < 70 GeV for “Leading Jet” and “Back-to-Back” events. Rick Field – Florida/CDF
Hard Radiation! “Transverse” PTsum Density vs ET(jet#1) “Leading Jet” “Back-to-Back” Min-Bias 0.24 GeV/c per unit h-f • Shows the average charged PTsum density, dPTsum/dhdf, in the “transverse” region (pT > 0.5 GeV/c, |h| < 1) versus ET(jet#1) for “Leading Jet” and “Back-to-Back” events. • Compares the (uncorrected) data with PYTHIA Tune A and HERWIG (without MPI) after CDFSIM. Rick Field – Florida/CDF
Latest CDF Run 2 “Underlying Event” Results The “underlying event” consists of the “beam-beam remnants” and possible multiple parton interactions, but inevitably received contributions from initial and final-state radiation. • Two Classes of Events: “Leading Jet” and “Back-to-Back”. • Two “Transverse” regions: “transMAX”, “transMIN”, “transDIF”. • Data Corrected to the Particle Level: unlike our previous CDF Run 2 “underlying event” analysis which used JetClu to define “jets” and compared uncorrected data with the QCD Monte-Carlo models after detector simulation, this analysis uses the MidPoint jet algorithm and corrects the observables to the particle level. The corrected observables are then compared with the QCD Monde-Carlo models at the particle level. • For the 1st time we study the energy density in the “transverse” region. “Transverse” region is very sensitive to the “underlying event”! Latest CDF Run 2 Results (L= 385 pb-1): Rick Field – Florida/CDF
“TransMAX/MIN” PTsum Density PYTHIA Tune A vs HERWIG PYTHIA Tune A does a fairly good job fitting the PTsum density in the “transverse” region! HERWIG does a poor job! “Back-to-Back” “Leading Jet” • Shows the charged particle PTsum density, dPTsum/dhdf, in the “transMAX” and “transMIN” region (pT > 0.5 GeV/c, |h| < 1) versus PT(jet#1) for “Leading Jet” and “Back-to-Back” events. • Compares the (corrected) data with PYTHIA Tune A (with MPI) and HERWIG (without MPI) at the particle level. Rick Field – Florida/CDF
“TransMAX/MIN” ETsum Density PYTHIA Tune A vs HERWIG “Back-to-Back” “Leading Jet” Neither PY Tune A or HERWIG fits the ETsum density in the “transferse” region! HERWIG does slightly better than Tune A! • Shows the data on the tower ETsum density, dETsum/dhdf, in the “transMAX” and “transMIN” region (ET > 100 MeV, |h| < 1) versus PT(jet#1) for “Leading Jet” and “Back-to-Back” events. • Compares the (corrected) data with PYTHIA Tune A (with MPI) and HERWIG (without MPI) at the particle level (all particles, |h| < 1). Rick Field – Florida/CDF
“TransDIF” ETsum Density PYTHIA Tune A vs HERWIG “Leading Jet” “Back-to-Back” “transDIF” is more sensitive to the “hard scattering” component of the “underlying event”! • Use the leading jet to define the MAX and MIN “transverse” regions on an event-by-event basis with MAX (MIN) having the largest (smallest) charged PTsum density. • Shows the “transDIF” = MAX-MIN ETsum density, dETsum/dhdf, for all particles (|h| < 1) versus PT(jet#1) for “Leading Jet” and “Back-to-Back” events. Rick Field – Florida/CDF
Possible Scenario?? Warning!? I am not sure I believe the data on the energy density. I am not convienced we are simulating correctly the “soft” energy in Calorimeter. • PYTHIA Tune A fits the charged particle PTsum density for pT > 0.5 GeV/c, but it does not produce enough ETsum for towers with ET > 0.1 GeV. • It is possible that there is a sharp rise in the number of particles in the “underlying event” at low pT (i.e. pT < 0.5 GeV/c). • Perhaps there are two components, a vary “soft” beam-beam remnant component (Gaussian or exponential) and a “hard” multiple interaction component. Rick Field – Florida/CDF
“TransMAX/MIN” ETsum Density PYTHIA Tune A vs JIMMY JIMMY was tuned to fit the energy density in the “transverse” region for “leading jet” events! JIMMY: MPI J. M. Butterworth J. R. Forshaw M. H. Seymour “Back-to-Back” “Leading Jet” • Shows the ETsum density, dETsum/dhdf, in the “transMAX” and “transMIN” region (all particles |h| < 1) versus PT(jet#1) for “Leading Jet” and “Back-to-Back” events. • Compares the (corrected) data with PYTHIA Tune A (with MPI) and a tuned version of JIMMY (with MPI, PTJIM = 3.25 GeV/c) at the particle level. Rick Field – Florida/CDF
“TransMAX/MIN” Nchg Density PYTHIA Tune A vs JIMMY “Back-to-Back” “Leading Jet” • Shows the charged particle density, dNchg/dhdf, in the “transMAX” and “transMIN” region (pT > 0.5 GeV/c, |h| < 1) versus PT(jet#1) for “Leading Jet” and “Back-to-Back” events. • Compares the (corrected) data with PYTHIA Tune A (with MPI) and a tuned version of JIMMY (with MPI, PTJIM = 3.25 GeV/c) at the particle level. Rick Field – Florida/CDF
“Transverse” <PT> PYTHIA Tune A vs JIMMY “Back-to-Back” “Leading Jet” • Shows the charged particle <PT> in the “transverse” (pT > 0.5 GeV/c, |h| < 1) versus PT(jet#1) for “Leading Jet” and “Back-to-Back” events. • Compares the (corrected) data with PYTHIA Tune A (with MPI) and HERWIG and a tuned version of JIMMY (with MPI, PTJIM = 3.25 GeV/c) at the particle level. Both JIMMY and HERWIG are too “soft” for pT > 0.5 GeV/c! Rick Field – Florida/CDF
CDF Run 1 PT(Z) PYTHIA 6.2 CTEQ5L UE Parameters • Shows the Run 1 Z-boson pT distribution (<pT(Z)> ≈ 11.5 GeV/c) compared with PYTHIA Tune A (<pT(Z)> = 9.7 GeV/c), Tune A25 (<pT(Z)> = 10.1 GeV/c), and Tune A50 (<pT(Z)> = 11.2 GeV/c). ISR Parameter Vary the intrensic KT! Intrensic KT Rick Field – Florida/CDF
CDF Run 1 PT(Z) Tune used by the CDF-EWK group! PYTHIA 6.2 CTEQ5L • Shows the Run 1 Z-boson pT distribution (<pT(Z)> ≈ 11.5 GeV/c) compared with PYTHIA Tune A (<pT(Z)> = 9.7 GeV/c), and PYTHIA Tune AW (<pT(Z)> = 11.7 GeV/c). UE Parameters Also fits the high pT tail! ISR Parameters Effective Q cut-off, below which space-like showers are not evolved. Intrensic KT The Q2 = kT2 in as for space-like showers is scaled by PARP(64)! Rick Field – Florida/CDF
Df Jet#1-Jet#2 Jet#1-Jet#2 Df Distribution Jet-Jet Correlations (DØ) • MidPoint Cone Algorithm (R = 0.7, fmerge = 0.5) • L= 150 pb-1 (Phys. Rev. Lett. 94 221801 (2005)) • Data/NLO agreement good. Data/HERWIG agreement good. • Data/PYTHIA agreement good provided PARP(67) = 1.0→4.0 (i.e. like Tune A, best fit 2.5). Rick Field – Florida/CDF
CDF Run 1 PT(Z) PYTHIA 6.2 CTEQ5L • Shows the Run 1 Z-boson pT distribution (<pT(Z)> ≈ 11.5 GeV/c) compared with PYTHIA Tune DW, and HERWIG. UE Parameters Also fits the high pT tail! ISR Parameters Tune DW uses D0’s perfered value of PARP(67)! Intrensic KT Tune DW has a lower value of PARP(67) and slightly more MPI! Rick Field – Florida/CDF
“Transverse” Nchg Density PYTHIA 6.2 CTEQ5L Three different amounts of MPI! UE Parameters • Shows the “transverse” charged particle density, dN/dhdf, versus PT(jet#1) for “leading jet” events at 1.96 TeV for PYTHIA Tune A, Tune AW, Tune DW, Tune BW, and HERWIG (without MPI). ISR Parameter • Shows the “transverse” charged particle density, dN/dhdf, versus PT(jet#1) for “leading jet” events at 1.96 TeV for Tune DW, ATLAS, and HERWIG (without MPI). Three different amounts of ISR! Intrensic KT Rick Field – Florida/CDF
“Transverse” PTsum Density PYTHIA 6.2 CTEQ5L Three different amounts of MPI! UE Parameters • Shows the “transverse” charged PTsum density, dPT/dhdf, versus PT(jet#1) for “leading jet” events at 1.96 TeV for PYTHIA Tune A, Tune AW, Tune DW, Tune BW, and HERWIG (without MPI). ISR Parameter • Shows the “transverse” charged PTsum density, dPT/dhdf, versus PT(jet#1) for “leading jet” events at 1.96 TeV for Tune DW, ATLAS, and HERWIG (without MPI). Three different amounts of ISR! Intrensic KT Rick Field – Florida/CDF
PYTHIA 6.2 Tunes PYTHIA 6.2 CTEQ5L CDF Run 2 Data! • Shows the “transverse” charged particle density, dN/dhdf, versus PT(jet#1) for “leading jet” events at 1.96 TeV for Tune A, DW, ATLAS, and HERWIG (without MPI). • Shows the “transverse” charged PTsum density, dPT/dhdf, versus PT(jet#1) for “leading jet” events at 1.96 TeV for Tune A, DW, ATLAS, and HERWIG (without MPI). • Shows the “transverse” charged average pT, versus PT(jet#1) for “leading jet” events at 1.96 TeV for Tune A, DW, ATLAS, and HERWIG (without MPI). Identical to DW at 1.96 TeV but uses ATLAS extrapolation to the LHC! Rick Field – Florida/CDF
PYTHIA 6.2 Tunes PYTHIA 6.2 CTEQ5L • Shows the “transverse” charged particle density, dN/dhdf, versus PT(jet#1) for “leading jet” events at 14 TeV for Tune A, DW, ATLAS, and HERWIG (without MPI). • Shows the “transverse” charged PTsum density, dPT/dhdf, versus PT(jet#1) for “leading jet” events at 14 TeV for Tune A, DW, ATLAS, and HERWIG (without MPI). • Shows the “transverse” charged average pT, versus PT(jet#1) for “leading jet” events at 14 TeV for Tune A, DW, ATLAS, and HERWIG (without MPI). Identical to DW at 1.96 TeV but uses ATLAS extrapolation to the LHC! Rick Field – Florida/CDF
PYTHIA 6.2 Tunes PYTHIA 6.2 • Shows the “transverse” charged particle density, dN/dhdf, versus PT(jet#1) for “leading jet” events at 1.96 TeV for Tune A, DW, and Tune QW (CTEQ6.1M). • Shows the “transverse” charged PTsum density, dPT/dhdf, versus PT(jet#1) for “leading jet” events at 1.96 TeV for Tune A, DW, and Tune QW (CTEQ6.1M). Uses LO as with L = 192 MeV! Rick Field – Florida/CDF
PYTHIA 6.2 Tunes PYTHIA 6.2 • Shows the “transverse” charged PTsum density, dPT/dhdf, versus PT(jet#1) for “leading jet” events at 1.96 TeV for Tune A, DW, and Tune QW (CTEQ6.1M). • Shows the “transverse” charged particle density, dN/dhdf, versus PT(jet#1) for “leading jet” events at 1.96 TeV for Tune A, DW, and Tune QW (CTEQ6.1M). Uses LO as with L = 192 MeV! Rick Field – Florida/CDF
Bruce Knuteson Khaldoun Makhoul Georgios Choudalakis Markus Klute Conor Henderson Ray Culbertson Gene Flanagan MIT Search Scheme 12 Exclusive 3 Jet Final State Challenge CDF Data At least 1 Jet (“trigger” jet) (PT > 40 GeV/c, |h| < 1.0) Normalized to 1 PYTHIA Tune A Exactly 3 jets (PT > 20 GeV/c, |h| < 2.5) R(j2,j3) R(j) = 0.4 Order Jets by PT Jet1 highest PT, etc. Rick Field – Florida/CDF
R > 1.0 3Jexc R(j2,j3) Normalized The data have more 3 jet events with small R(j2,j3)!? • Let Ntrig40 equal the number of events with at least one jet with PT > 40 geV and |h| < 1.0 (this is the “offline” trigger). • Let N3Jexc20 equal the number of events with exactly three jets with PT > 20 GeV/c and |h| < 2.5 which also have at least one jet with PT > 40 GeV/c and |h| < 1.0. Normalized to N3JexcFr • Let N3JexcFr = N3Jexc20/Ntrig40. The is the fraction of the “offline” trigger events that are exclusive 3-jet events. • The CDF data on dN/dR(j2,j3) at 1.96 TeV compared with PYTHIA Tune AW (PARP(67)=4), Tune DW (PARP(67)=2.5), Tune BW (PARP(67)=1). • PARP(67) affects the initial-state radiation which contributes primarily to the region R(j2,j3) > 1.0. Rick Field – Florida/CDF
R < 1.0 3Jexc R(j2,j3) Normalized I do not understand the excess number of events with R(j2,j3) < 1.0. Perhaps this is related to the “soft energy” problem?? For now the best tune is PYTHIA Tune DW. • Let Ntrig40 equal the number of events with at least one jet with PT > 40 geV and |h| < 1.0 (this is the “offline” trigger). • Let N3Jexc20 equal the number of events with exactly three jets with PT > 20 GeV/c and |h| < 2.5 which also have at least one jet with PT > 40 GeV/c and |h| < 1.0. Normalized to N3JexcFr • Let N3JexcFr = N3Jexc20/Ntrig40. The is the fraction of the “offline” trigger events that are exclusive 3-jet events. • The CDF data on dN/dR(j2,j3) at 1.96 TeV compared with PYTHIA Tune DW (PARP(67)=2.5) and HERWIG (without MPI). • Final-State radiation contributes to the region R(j2,j3) < 1.0. • If you ignore the normalization and normalize all the distributions to one then the data prefer Tune BW, but I believe this is misleading. Rick Field – Florida/CDF
“Hard Scattering” Component QCD Monte-Carlo Models:Lepton-Pair Production • Start with the perturbative Drell-Yan muon pair production and add initial-state gluon radiation (in the leading log approximation or modified leading log approximation). “Underlying Event” • The “underlying event” consists of the “beam-beam remnants” and from particles arising from soft or semi-soft multiple parton interactions (MPI). • Of course the outgoing colored partons fragment into hadron “jet” and inevitably “underlying event” observables receive contributions from initial and final-state radiation. Rick Field – Florida/CDF
The “Central” Regionin Drell-Yan Production Look at the charged particle density and the PTsum density in the “central” region! Charged Particles(pT > 0.5 GeV/c, |h| < 1) • Look at the “central” region after removing the lepton-pair. • Study the charged particles (pT > 0.5 GeV/c, |h| < 1) and form the charged particle density, dNchg/dhdf, and the charged scalar pT sum density, dPTsum/dhdf, by dividing by the area in h-f space. After removing the lepton-pair everything else is the “underlying event”! Rick Field – Florida/CDF
Drell-Yan Production (Run 2 vs LHC) Lepton-Pair Transverse Momentum • Average Lepton-Pair transverse momentum at the Tevatron and the LHC for PYTHIA Tune DW and HERWIG (without MPI). <pT(m+m-)> is much larger at the LHC! Shapes of the pT(m+m-) distribution at the Z-boson mass. Z • Shape of the Lepton-Pair pT distribution at the Z-boson mass at the Tevatron and the LHC for PYTHIA Tune DW and HERWIG (without MPI). Rick Field – Florida/CDF
The “Underlying Event” inDrell-Yan Production The “Underlying Event” Charged particle density versus M(pair) • Charged particle density versus the lepton-pair invariant mass at 1.96 TeV for PYTHIA Tune AW and HERWIG (without MPI). HERWIG (without MPI) is much less active than PY Tune AW (with MPI)! “Underlying event” much more active at the LHC! Z Z • Charged particle density versus the lepton-pair invariant mass at 14 TeV for PYTHIA Tune AW and HERWIG (without MPI). Rick Field – Florida/CDF
Extrapolations to the LHC:Drell-Yan Production Charged particle density versus M(pair) The “Underlying Event” • Average charged particle density versus the lepton-pair invariant mass at 1.96 TeV for PYTHIA Tune A, Tune AW, Tune BW, Tune DW and HERWIG (without MPI). Tune DW and DWT are identical at 1.96 TeV, but have different MPI energy dependence! Z Z • Average charged particle density versus the lepton-pair invariant mass at 1.96 TeV for PYTHIA Tune A, Tune DW, ATLAS and HERWIG (without MPI). • Average charged particle density versus the lepton-pair invariant mass at 14 TeV for PYTHIA Tune DW, Tune DWT, ATLAS and HERWIG (without MPI). Rick Field – Florida/CDF
Extrapolations to the LHC:Drell-Yan Production Charged particle charged PTsum density versus M(pair) The “Underlying Event” • Average charged PTsum density versus the lepton-pair invariant mass at 1.96 TeV for PYTHIA Tune A, Tune AW, Tune BW, Tune DW and HERWIG (without MPI). The ATLAS tune has a much “softer” distribution of charged particles than the CDF Run 2 Tunes! Z Z • Average charged PTsum density versus the lepton-pair invariant mass at 1.96 TeV for PYTHIA Tune A, DW, ATLAS, and HERWIG (without MPI). • Average charged PTsum density versus the lepton-pair invariant mass at 14 TeV for PYTHIA Tune DW, Tune DWT, ATLAS, and HERWIG (without MPI). Rick Field – Florida/CDF
Extrapolations to the LHC:Drell-Yan Production Charged particle density versus M(pair) The “Underlying Event” • Average charged particle density (pT > 0.5 GeV/c) versus the lepton-pair invariant mass at 14 TeV for PYTHIA Tune DW, Tune DWT, ATLAS and HERWIG (without MPI). The ATLAS tune has a much “softer” distribution of charged particles than the CDF Run 2 Tunes! Charged Particles (|h|<1.0, pT > 0.5 GeV/c) Charged Particles (|h|<1.0, pT > 0.9 GeV/c) Z Z • Average charged particle density (pT > 0.9 GeV/c) versus the lepton-pair invariant mass at 14 TeV for PYTHIA Tune DW, Tune DWT, ATLAS and HERWIG (without MPI). Rick Field – Florida/CDF
Proton-AntiProton Collisionsat the Tevatron The CDF “Min-Bias” trigger picks up most of the “hard core” cross-section plus a small amount of single & double diffraction. stot = sEL + sIN stot = sEL + sSD+sDD+sHC 1.8 TeV: 78mb = 18mb + 9mb + (4-7)mb + (47-44)mb CDF “Min-Bias” trigger 1 charged particle in forward BBC AND 1 charged particle in backward BBC The “hard core” component contains both “hard” and “soft” collisions. Beam-Beam Counters 3.2 < |h| < 5.9 Rick Field – Florida/CDF
PYTHIA Tune A Min-Bias“Soft” + ”Hard” Tuned to fit the “underlying event”! PYTHIA Tune A CDF Run 2 Default 12% of “Min-Bias” events have PT(hard) > 5 GeV/c! 1% of “Min-Bias” events have PT(hard) > 10 GeV/c! • PYTHIA regulates the perturbative 2-to-2 parton-parton cross sections with cut-off parameters which allows one to run with PT(hard) > 0. One can simulate both “hard” and “soft” collisions in one program. Lots of “hard” scattering in “Min-Bias”! • The relative amount of “hard” versus “soft” depends on the cut-off and can be tuned. • This PYTHIA fit predicts that 12% of all “Min-Bias” events are a result of a hard 2-to-2 parton-parton scattering with PT(hard) > 5 GeV/c (1% with PT(hard) > 10 GeV/c)! Rick Field – Florida/CDF
PYTHIA Tune ALHC Min-Bias Predictions 12% of “Min-Bias” events have PT(hard) > 10 GeV/c! LHC? • Shows the center-of-mass energy dependence of the charged particle density, dNchg/dhdfdPT, for “Min-Bias” collisions compared with PYTHIA Tune A with PT(hard) > 0. 1% of “Min-Bias” events have PT(hard) > 10 GeV/c! • PYTHIA Tune A predicts that 1% of all “Min-Bias” events at 1.8 TeV are a result of a hard 2-to-2 parton-parton scattering with PT(hard) > 10 GeV/c which increases to 12% at 14 TeV! Rick Field – Florida/CDF
PYTHIA 6.2 TunesLHC Min-Bias Predictions • Shows the predictions of PYTHIA Tune A, Tune DW, Tune DWT, and the ATLAS tune for the charged particle density dN/dh and dN/dY at 14 TeV (all pT). • PYTHIA Tune A and Tune DW predict about 6 charged particles per unit h at h = 0, while the ATLAS tune predicts around 9. • PYTHIA Tune DWT is identical to Tune DW at 1.96 TeV, but extrapolates to the LHC using the ATLAS energy dependence. Rick Field – Florida/CDF
PYTHIA 6.2 TunesLHC Min-Bias Predictions • Shows the predictions of PYTHIA Tune A, Tune DW, Tune DWT, and the ATLAS tune for the charged particle pT distribution at 14 TeV (|h| < 1) and the average number of charged particles with pT > pTmin (|h| < 1). • The ATLAS tune has many more “soft” particles than does any of the CDF Tunes. The ATLAS tune has <pT> = 548 MeV/c while Tune A has <pT> = 641 MeV/c (100 MeV/c more per particle)! Rick Field – Florida/CDF
Tevatron LHC Summary The ATLAS tune cannot be right because it does not fit the Tevatron data. Right now I like Tune DW. Probably no tune will fit the LHC data. That is why we plan to measure MB&UE at CMS and retune the Monte-Carlo models! I am not sure I believe the data!? • PYTHIA Tune A does not produce enough “soft” energy in the “underlying event”! JIMMY 325 (PTJIM = 3.25 GeV/c) fits the energy in the “underlying event” but does so by producing too many particles (i.e. it is too soft). • The ATLAS tune is “goofy”! It produces too many “soft” particles. The charged particle <pT> is too low and does not agree with the CDF Run 2 data. The ATLAS tune agrees with <Nchg> but not with <PTsum> at the Tevatron. • PYTHIA Tune DW is very similar to Tune A except that it fits the CDF PT(Z) distribution and it uses the DØ prefered value of PARP(67) = 2.5 (determined from the dijet Df distribution). • PYTHIA Tune DWT is identical to Tune DW at 1.96 TeV but uses the ATLAS energy extrapolation to the LHC (i.e. PARP(90) = 0.16). Rick Field – Florida/CDF