Download
1 / 6
60 likes | 78 Views
Analysis - 1 st with Minitab. Regression Analysis: Capacity versus Age, Height, ... The regression equation is Capacity = - 6.17 - 0.0140 Age + 0.149 Height + 0.00636 Weight - 0.0087 Chest - 0.0220 Waist + 0.343 Activity - 0.109 Smoke - 0.409 Gender

E N D
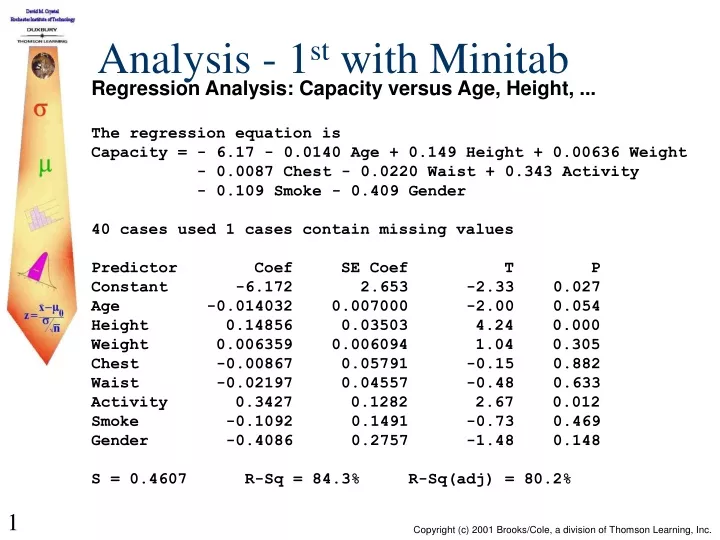
Analysis - 1st with Minitab Regression Analysis: Capacity versus Age, Height, ... The regression equation is Capacity = - 6.17 - 0.0140 Age + 0.149 Height + 0.00636 Weight - 0.0087 Chest - 0.0220 Waist + 0.343 Activity - 0.109 Smoke - 0.409 Gender 40 cases used 1 cases contain missing values Predictor Coef SE Coef T P Constant -6.172 2.653 -2.33 0.027 Age -0.014032 0.007000 -2.00 0.054 Height 0.14856 0.03503 4.24 0.000 Weight 0.006359 0.006094 1.04 0.305 Chest -0.00867 0.05791 -0.15 0.882 Waist -0.02197 0.04557 -0.48 0.633 Activity 0.3427 0.1282 2.67 0.012 Smoke -0.1092 0.1491 -0.73 0.469 Gender -0.4086 0.2757 -1.48 0.148 S = 0.4607 R-Sq = 84.3% R-Sq(adj) = 80.2%
Analysis - 2nd with Minitab Notice that the P-values on the right suggest that only the predictors height (P-value = 0.000) and activity level (P-value = 0.012) are significant at the 0.05 level of significance. The only other variable that seem possibly significant are age (P-value = 0.054 and gender (P-value =0.148). When stepwise regression techniques are applied using Minitab, the variables that remain significant are height, activity level, age and gender. The output is on the next two slides.
Analysis - 2nd with Minitab Stepwise Regression: Capacity versus Age, Height, ... Alpha-to-Enter: 0.1 Alpha-to-Remove: 0.1 Response is Capacity on 8 predictors, with N = 40 N(cases with missing observations) = 1 N(all cases) = 41 Step 1 2 3 4 Constant -10.251 -9.759 -9.787 -6.929 Height 0.209 0.191 0.198 0.161 T-Value 10.42 9.87 10.43 6.55 P-Value 0.000 0.000 0.000 0.000 Activity 0.35 0.31 0.30 T-Value 2.87 2.60 2.67 P-Value 0.007 0.013 0.011
Analysis - 2nd with Minitab Activity 0.35 0.31 0.30 T-Value 2.87 2.60 2.67 P-Value 0.007 0.013 0.011 Age -0.0109 -0.0137 T-Value -1.96 -2.54 P-Value 0.057 0.016 Gender -0.47 T-Value -2.24 P-Value 0.032 S 0.534 0.490 0.472 0.448 R-Sq 74.06 78.78 80.84 83.23 R-Sq(adj) 73.38 77.63 79.24 81.32 C-p 15.1 7.8 5.8 3.0
Analysis - 2nd with Minitab The resulting Minitab output from the regression analysis using those 4 predictors follows. Regression Analysis: Capacity versus Height, Activity, Gender, Age The regression equation is Capacity = - 6.93 + 0.161 Height + 0.302 Activity - 0.466 Gender - 0.0137 Age 40 cases used 1 cases contain missing values Predictor Coef SE Coef T P Constant -6.929 1.708 -4.06 0.000 Height 0.16079 0.02454 6.55 0.000 Activity 0.3025 0.1133 2.67 0.011 Gender -0.4658 0.2082 -2.24 0.032 Age -0.013744 0.005404 -2.54 0.016 S = 0.4477 R-Sq = 83.2% R-Sq(adj) = 81.3%
Analysis - 2nd with Minitab Consider the following graphs: residuals vs fits and the normal plot of the residual.