Download
1 / 12
120 likes | 130 Views
Enhancing ER Diagrams to View Data Transformations Computed with Queries. Disclaimer. Teaching Database Systems courses many years Database processing requires understanding data structure before processing But I have hardly worked on conceptual modeling or database modeling

E N D
Enhancing ER Diagrams to View Data Transformations Computed with Queries
Disclaimer • Teaching Database Systems courses many years • Database processing requires understanding data structure before processing • But I have hardly worked on conceptual modeling or database modeling • Ladjel gave me guidance
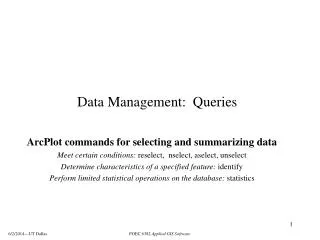
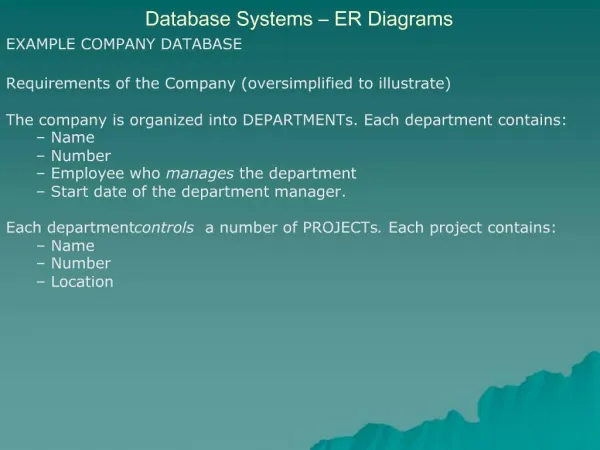
Motivation: Data Sets for Analytics • Input for Machine Learning or Statistical Models: n records, p features/variables (dimensions, categorical/discrete) • Built by many SQL queries: SPJA • Original database does have some ER diagram behind, maybe denormalized • Queries, views: disorganized, written independently • DB populated by queries instead of transactions/ETL • Data set does have entity (and relational) representation • In general, no ER diagram exists for temporary tables/views/exports
Our contributions • Extending existing ER diagram with “data transformation entities” • Minimal changes to UML diagram notation • Entity universe: source + transformation • Tranformed attribute: any expression from SPJA relational algebra • Fast algorithm to create ER diagram from queries • Preliminary study of ER diagram properties
Preliminaries • UML entity notation: scalable, Object-Oriented • n tables: all linked by 1:N and 1:1 relationships • Entity and referential integrity: satisfied Ti (K) Tj (K) K (T i ) K (T j ) • New tables derivedvonly with SPJA queries • Derived attributes with aggregations, math and string expressions, including CASE statements
Our ER diagram extensions • Logical level: minimal: • labeling entity names, • same notation for relationships • Physical level (SQL): • zoom in view with relational queries • Semantics: data analyst point of view
Data Transformations • Entity (table) level: only relational queries • join (denormalization to gather attributes, left outer joins) • aggregation/projection (to derive new attributes) • selection (filter is important) • Attribute (column) level: • denormalization (expressions, functions, CASE) • aggregation (GROUP BY, global)
Properties of our ER diagram • Logical and physical level come closer, but still separate • PKs and Fks remain the glue • Queries take the role of insert/delete/update in traditional DB • Complete (no table left out) and consistent (every piece of data derived via queries) • Transformation entities are weak entities • Provenance can be tracked; flow can be embedded in entity labels
Conclusions • Any diagram helps analysts, but there will not be an ER model in the traditional sense • A first step to have a DB ER diagram of data transformations • Complements flow diagrams • Relational, but can be later extended to non-relational data (text, semistructured) • DB state: As of now, source refreshed via transactions/ETL. Versioning: future ( temporal & stream databases)