Download
1 / 17
190 likes | 540 Views
Head circumference. By Zani Alam WPGH. Learning intention: interpreting growth charts. The distance around something. Circumference of a circle. C ircumference reminds me of. The boundary line. Perimeter of a circle. Percentile is not the same as percentage. Rank. Percentile.

E N D
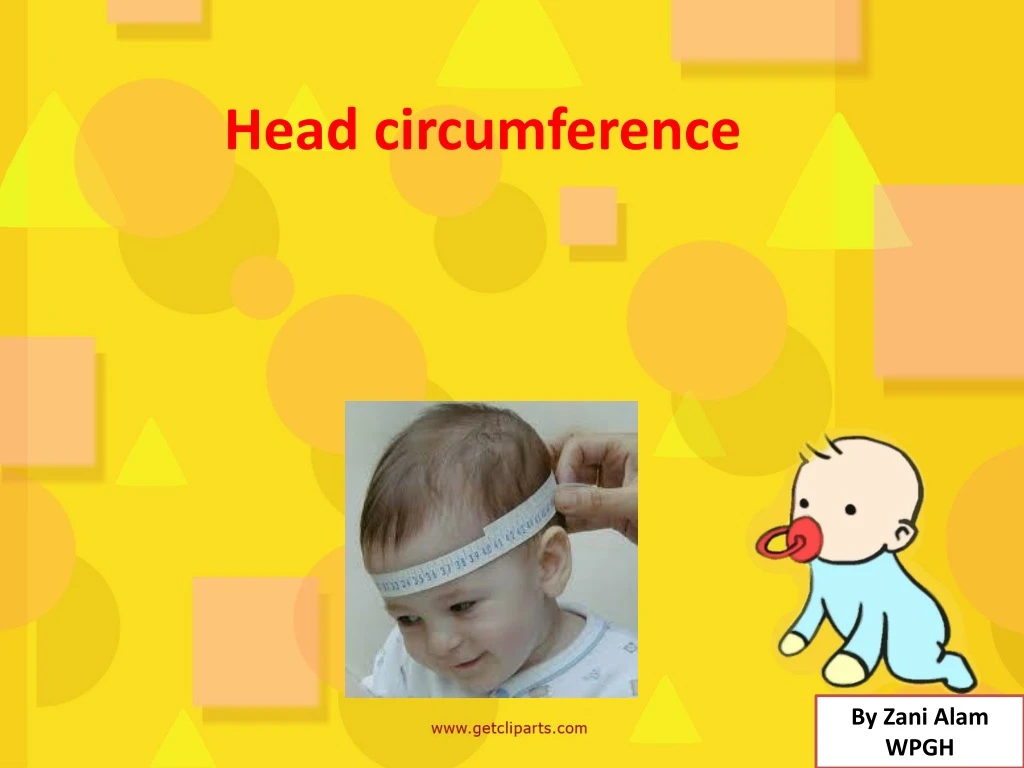
Headcircumference By ZaniAlam WPGH
The distance around something Circumference of a circle Circumference reminds me of The boundary line Perimeter of a circle
Percentile is not the same as percentage Rank Percentile Can be confused with precent or percentage comparing something such as test scores, height, salaries etc
Percentile charts are used to plot your baby's changing weight, length (or height), and head circumference, and are often referred to as 'percentile charts'.
Percentile charts aim: • to give you a visual indication about how your baby is progressing over time. • See where they fall in relation to the rest of the population average, for either girls or boys.
The percentile graphs are marked with curved lines that represent the different percentiles. The main percentile bands are the 10th, 50th and 90th percentiles, but they may also have the 5th, 25th, 75th and 95th percentiles.
Percentile ranks are an easy way to convey an individual's standing at graduation relative to other graduates.
http://www0.health.nsw.gov.au/pubs/2011/pdf/blue_book_2011_48-61.pdfhttp://www0.health.nsw.gov.au/pubs/2011/pdf/blue_book_2011_48-61.pdf
Heading Marked with curved lines 10th percentile Vertical axis: head circumference The scale on the side is going up by 0.2 37 Measurement are in: cm and in Starting at birth means 0 Horizontal axis: age in months 36 months. How many years?
For head circumference • If your head circumference lies on the 10th percentile, what does it mean? • It means 10 % of the children have a circumference smaller than you and 90 % of children have a circumference bigger than you.
Q: If your head circumference lies on the75th percentile what does it mean? • it means 25 of the kids have a circumference higher than you and 75% lower than you.
If you lie on the middle which is the thick line (50th) you have the middle percentile (median) you are in the middle.
For weight If your baby is on the '10th percentile' for weight, it means that 90% of other babies their age are heavier than he or she is, and 10% of other babies weigh less. If your baby is on the 95th percentile, only 5% of other babies of the same age are heavier than your baby, and 95% weigh less.
Activity1 Use a tape measure and measure your partner’s head circumference. Activity2 Give students a blank chart and give all the words and they have to paste them on the graph. Head Circumference Chart For an accurate head measure, place a tape measure across the forehead and measure around the full circumference of the head. http://www.craftyarncouncil.com/headsize.html
Heading Heading Heading Vertical axis: Head circumference Vertical axis: Head circumference Vertical axis: Head circumference The scale on the side is going up by 0.2 The scale on the side is going up by 0.2 The scale on the side is going up by 0.2 Measurement are in: cm and in Measurement are in: cm and in Measurement are in: cm and in Starting at birth means 0 Starting at birth means 0 Starting at birth means 0 Horizontal axis: age in months Horizontal axis: age in months Horizontal axis: age in months Marked with curved lines Marked with curved lines Marked with curved lines 10th percentile 10th percentile 10th percentile 36 months 36 months 36 months