Download
1 / 128
1.29k likes | 1.31k Views
Chap.20 Energy Flow and Food Webs. 鄭先祐 (Ayo) 教授 國立台南大學 環境與生態學院 生態科學與技術學系 環境生態 + 生態旅遊 ( 碩士班 ). 20 Energy Flow and Food Webs. Case Study: Toxins in Remote Places Feeding Relationships Energy Flow among Trophic Levels Trophic Cascades Food Webs Case Study Revisited

E N D
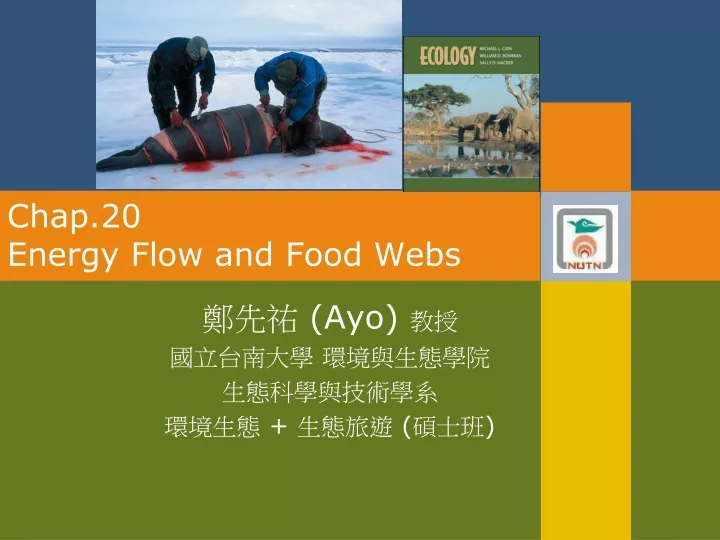
Chap.20 Energy Flow and Food Webs 鄭先祐 (Ayo) 教授 國立台南大學 環境與生態學院 生態科學與技術學系 環境生態 + 生態旅遊 (碩士班)
20 Energy Flow and Food Webs Case Study: Toxins in Remote Places Feeding Relationships Energy Flow among Trophic Levels Trophic Cascades Food Webs Case Study Revisited Connections in Nature: Biological Transport of Pollutants
Case Study: Toxins in Remote Places The Arctic has been thought of as one of the most remote and pristine areas on Earth. But, starting with studies of PCBsin human breast milk, researchers began to realize there were high levels of pollutants in the Arctic.
Case Study: Toxins in Remote Places PCBs belong to a group of chemical compounds called persistent organic pollutants (POPs) because they remain in the environment for a long time. A study of PCBs in breast milk of women in southern Ontario required a population from a pristine area for comparison.
Case Study: Toxins in Remote Places Inuit mothers from northern Canada were used as a “control.” The Inuit are primarily subsistence hunters, and have no developed industry or agriculture that would expose them to POPs.
Figure 20.1 Subsistence Hunting Inuit hunters peel layers of skin and fat off of a slaughtered seal in a remote, very sparsely populated Arctic region.
Case Study: Toxins in Remote Places However, the Inuit women had concentrations of PCBs in their breast milk that were seven times higher than in women to the south (Dewailly et al. 1993). Other studies also reported high levels of PCBs in Inuit from Canada and Greenland.
Figure 20.2 Persistent Organic Pollutants in Canadian Women The breast milk of Inuit mothers from northern Canada was found to contain substantially higher concentrations of polychlorinated biphenyls (PCBs) and two other POPs – dichloro-diphenyl-dichloroethylene (DDE, a pesticide similar to DDT), and hexa-chloro-benzene (HCB, an agricultural fungicide) -- than that of mothers from southern Quebec.
Case Study: Toxins in Remote Places How do these toxins make their way to the Arctic? POPs produced at low latitudes enter the atmosphere (they are in gaseous form at the temperatures there). They are carried by atmospheric circulation patterns to the Arctic, where they condense to liquid forms and fall from the atmosphere.
Case Study: Toxins in Remote Places Manufacture and use of POPs has been banned in North America but some developing countries still use them. Emissions of POPs have decreased, but they may remain in Arctic snow and ice for many decades, being released slowly during snowmelt every spring and summer.
Case Study: Toxins in Remote Places There is a correlation between POPs and diet. Communities that rely on marine mammals for their food tend to have the highest levels of POPs. Communities that consume herbivorous caribou tend to have lower levels.
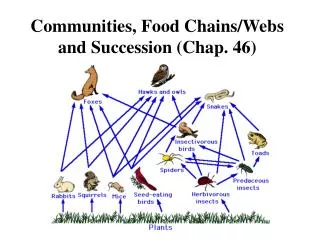
Introduction What links organisms together in in the context of ecological functioning is their trophic interactions —what they eat and what eats them. The influence of an organism on the movement of energy and nutrients through an ecosystem is determined by the type of food it consumes, and by what consumes it.
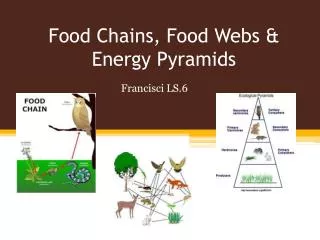
Feeding Relationships Concept 20.1: Trophic levels describe the feeding positions of groups of organisms in ecosystems. Each feeding category, or trophic level, is based on the number of feeding steps by which it is separated from autotrophs. The first trophic level consists of autotrophs (primary producers) .
Figure 20.3 Trophic Levels in a Desert Ecosystem In trophic studies, detritus is considered part of the first trophic level, and detritivores are grouped with herbivores in the second trophic level. All organisms not consumed by other organisms end up as detritus.
Feeding Relationships The first trophic level generates chemical energy from sunlight or inorganic chemical compounds. The first trophic level also generates most of the dead organic matter in an ecosystem.
Feeding Relationships Second trophic level —herbivores that consume autotrophs. It also includes the detritivores that consume dead organic matter. Third (and higher) trophic levels —carnivores that consume animals from the level below.
Feeding Relationships Some organisms do not conveniently fit into trophic levels. Omnivores feed at multiple trophic levels. Example: Coyotes are opportunistic feeders, consuming vegetation, mice, other carnivores, and old leather boots.
Feeding Relationships All organisms in an ecosystem are either consumed by other organisms or enter the pool of dead organic matter (detritus). In terrestrial ecosystems, only a small portion of the biomass is consumed, and most of the energy flow passes through the detritus.
Figure 20.4 Ecosystem Energy Flow through Detritus (Part 1) (A) Detritus is consumed by a multitude of organisms, including fungi and crustaceans such as the common wood louse (木羽虱).Most of the NPP in terrestrial and aquatic ecosystems end up as detritus.
Figure 20.4 Ecosystem Energy Flow through Detritus (Part 2) In most of the studies, more than 50% of NPP ends up as detritus.
Figure 20.4 Ecosystem Energy Flow through Detritus (Part 3) In most of the studies, only a small proportion of NPP is consumed by herbivores. These trends are stronger for terrestrial ecosystems than for aquatic ecosystems.
Feeding Relationships Dead plant, microbial, and animal matter, and feces, are consumed by organisms called detritivores (primarily bacteria and fungi), in a process known as decomposition. Detritus is considered part of the first trophic level, and thus detritivores are part of the second level.
Feeding Relationships Much of the input of detritus into streams, lakes, and estuarine ecosystems is derived from terrestrial organic matter. These external energy inputs are called allochthonousinputs. Energy produced by autotrophs within the system is autochthonous energy.
Feeding Relationships Allochthonous inputs can be very important in stream ecosystems. Example: Bear Brook in New Hampshire receives 99.8% of its energy as allochthonous inputs. In nearby Mirror Lake, autochthonous energy accounts for almost 80% of the energy budget.
Feeding Relationships The river continuum concept states that the importance of autochthonous energy inputs increases from the headwaters toward the lower reaches of a river. Water velocity decreases, and nutrient concentrations tend to increase as you go downstream.
Energy Flow among Trophic Levels The second law of thermodynamics states that during any transfer of energy, some is lost due to the tendency toward an increase in disorder (entropy). Energy will decrease with each trophic level. Concept 20.2: The amount of energy transferred from one trophic level to the next depends on food quality and consumer abundance and physiology.
Energy Flow among Trophic Levels A trophic pyramid is a graphical representation of trophic relationships. A series of rectangles portray the relative amounts of energy or biomass of each level. A proportion of the biomass at each trophic level is not consumed, and a proportion of the energy at each trophic level is lost in the transfer to the next trophic level.
Energy Flow among Trophic Levels In terrestrial ecosystems, energy and biomass pyramids are usually similar because biomass is closely associated with energy production. In aquatic ecosystems, the biomass pyramid may be inverted. The primary producers are phytoplankton with short life spans and high turnover.
Energy Flow among Trophic Levels The tendency toward inverted biomass pyramids is greatest where productivity is lowest, such as in nutrient-poor regions of the open ocean. This results from more rapid turnover of phytoplankton, associated with higher growth rate and shorter life span compared with phytoplankton of more nutrient-rich waters.
Energy Flow among Trophic Levels Herbivoreson land consume a much lower proportion of autotroph biomass than herbivores in most aquatic ecosystems. On average, about 13% of terrestrial NPP is consumed; in aquatic ecosystems, an average of 35% NPP is consumed.
Energy Flow among Trophic Levels There is a positive relationship between net primary production and the amount of biomass consumed by herbivores. This suggests that herbivore production is limited by the amount of food available. Why don’t terrestrial herbivores consume more of the available biomass?
Figure 20.6 Consumption of Autotroph Biomass Is Correlated with NPP The amount of autotroph biomass consumed is significantly higher in aquatic ecosystems than in terrestrial ecosystems.
Energy Flow among Trophic Levels Several hypotheses have been proposed. Herbivore populations are constrained by predators, and never reach carrying capacity. Predator removal experiments support this hypothesis in some ecosystems.
Energy Flow among Trophic Levels Autotrophs have defenses against herbivory, such as secondary compounds and structural defenses, like spines. Plants of resource-poor environments tend to have stronger defenses than plants from resource-rich environments.
Energy Flow among Trophic Levels Terrestrial plants have nutrient-poor structural materials such as stems and wood, which are typically absent in aquatic autotrophs. Phytoplankton are more nutritious for herbivores than are terrestrial plants.
Energy Flow among Trophic Levels The quality of food can be indicated by the ratio of carbon to nutrients such as N and P. Freshwater phytoplankton have carbon:nutrient ratios closer to those of herbivores than to those of terrestrial plants.
Energy Flow among Trophic Levels Trophic efficiency—the amount of energy at one trophic level divided by the amount of energy at the trophic level immediately below it.
Energy Flow among Trophic Levels Trophic efficiency incorporates three types of efficiency: The proportion of available energy that is consumed (consumption efficiency). The proportion of ingested food that is assimilated (assimilation efficiency). The proportion of assimilated food that goes into new consumer biomass (production efficiency).
Figure 20.7 Energy Flow and Trophic Efficiency Consumption efficiency is the proportion of the available biomass that is ingested by consumers. Assimilation efficiency is the proportion of the ingested biomass that consumers assimilate by digestion. Production efficiency is the proportion of assimilated biomass used to produce new consumer biomass. Biomass that is not ingested or assimilated enters the pool of detritus.
Energy Flow among Trophic Levels Consumption efficiency is higher in aquatic ecosystems than in terrestrial ecosystems. Consumption efficiencies also tend to be higher for carnivores than for herbivores.
Energy Flow among Trophic Levels Assimilation efficiency is determined by the quality of the food and the physiology of the consumer. Food quality of plants and detritus is lower than animals because of complex compounds such as cellulose, lignins, and humic acids, that are not easily digested, and low concentrations of nutrients such as N and P.
Energy Flow among Trophic Levels Animal bodies have carbon:nutrient ratios similar to that of the animal consuming them, and so are assimilated more readily. Assimilation efficiencies of herbivores and detritivores vary between 20%–50%, carnivores are about 80%.
Energy Flow among Trophic Levels Endotherms tend to digest food more completely than ectotherms and thus have higher assimilation efficiencies. Some herbivores have mutualistic symbionts that help them digest cellulose.
Energy Flow among Trophic Levels Ruminants (cattle, deer, camels) have a modified foregut that contains bacteria and protists that break down cellulose-rich foods. This gives ruminants higher assimilation efficiencies than nonruminant herbivores.
Energy Flow among Trophic Levels Production efficiency is strongly related to the thermal physiology and size of the consumer. Endotherms allocate more energy to heat production, and have less for growth and reproduction than ectotherms.
Energy Flow among Trophic Levels Body size affects heat loss in endotherms. As body size increases, the surface area-to-volume ratio decreases. A small endotherm, such as a shrew, will lose a greater proportion of its internally generated heat across its body surface than a large endotherm, such as a grizzly bear, and will have lower production efficiency.
Energy Flow among Trophic Levels Changes in food quantity and quality, and the resulting changes in trophic efficiency, can determine consumer population sizes. Steller sea lion populations in Alaska declined by about 80% over 25 years. Smaller body size and decreased birth rates suggested food quantity or quality might be a problem.