Download
1 / 63
630 likes | 631 Views
This study investigates the trends of PCB isomeric patterns in Japanese environmental media, food, breast milk, and blood, with a focus on risk assessment. The analysis includes the use of various congeners and the evaluation of PCB levels in different samples over time.

E N D
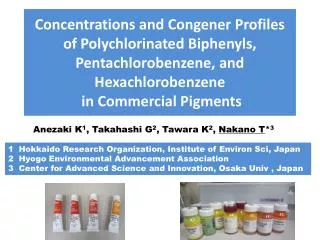
Trends of PCB isomeric patterns in Japanese environmental media, food, breast milk and blood in view of risk assessment Takeshi Nakano1, Yoshimasa Konishi2, Rie Masho3 and Chiharu Tohyama4
2,3,4,7,8-PeCDF 2,3,7,8-TCDD 75 congeners 135congeners 75 congeners 209 congeners 1,2,3,5,6,7-HxCN 3,4,5,3’,4’-Co-PCB
Trend of PCB Use in Japan Total58,000t Amount of PCB use (t)
PCB product use in Japan 1969-1971 KC-300 400 500 600 Ar-1242 1248 1254 1260
KC300 Japan KC400 Homologue pattern reflects product use KC500 KC600 Japan
PCB Homologue Distribution and Source Estimation
Source estimation KC300 KC500 Insulator N.C.P. capacitor Sediment A Sediment B KC400 KC600 Ship paint Insulator capacitor
Time trend of PCDDs/PCDFs(TEQ) Dioxin Emission Reduction Plan Matsumura et al, symposium of J.Env.Chem, 2003.6
Emission inventry vs Level in air 0.50 1997 0.40 1998 0.30 1999 PCDDs/PCDFs(pg-TEQ/m3) 0.20 2000 0.10 2001 0.00 0 8000 7000 6000 5000 4000 3000 2000 1000 Emission inventry (g-TEQ/year) Matsumura et al, symposium of J.Env.Chem, 2003.6
Time trend of Co-PCBs(TEQ) Matsumura et al, symposium of J.Env.Chem, 2003.6
3 ( ng/m ) 3 ( pg/m ) 1000 100 10 1 0.1 0.01 1970 1975 1980 1985 1990 1995 2000 2005 3 Time trend of PCBs concentration in ambient air (ng/m ) 3 Time trend of PCBs concentration in ambient air (pg/m ) Ambient air
µg / g-fat 0.3 0.2 0.1 0 µg g-fat PCB Time trend of breast milk levels 60 40 20 0 60 40 20 0 pg TEQ/g-fat pg TEQ/g-fat Dioxins Year (1973-2000) Year (1973-2000) Konishi et al. (2003) Konishi et al (2003) Organohalogen compds
Development of congener specific analysis for PCBs using HT8-PCB
Congener number number of isomer of peakmono 3 3di 12 10tri 24 23tetra 42 39penta 46 38hexa 42 40hepta 24 23octa 12 12nona 3 3deca 1 1 total 209 192
GC/MS-SIM chromatogram of TrCB (HT8-PCB) PCB product 13C-TrCB Matsumura et al, J. Env. Chem. (2002)
P5CB 800000 Intensity 400000 0 20 22 24 26 28 30 32 34 36 38 Retention Time (min) Calculated Retention Time #104 #103 #100 #102 #121 #101 #113 #112 #119 #117 #125 #116 #111 #120 #110 #124 #109 #107 #123 #106 #118 #114 #122 #105 #127 #126 #96 #94 #93 #98 #95 #88 #91 #92 #84 #89 #90 #99 #83 #86 #97 #87 #85 #82 #108 #115 13C-P5CB 50000 Intensity 0 20 22 24 26 28 30 32 34 36 38 Retention Time (min) GC/MS-SIM chromatogram of PeCB (HT8-PCB) PCB product 13C-PeCB Matsumura et al, J. Env. Chem. (2002)
Congener profiles of PCBs(Di-, Tri-) in environmental samples
Congener profiles of PCBs(Hexa-) in environmental and human samples
Congener profiles of PCBs(Hepta-) in environmental and human samples
#70 PCB product #66 25-25 25-34 25-23 #52 245-4 #44 23-34 #74 #56 #60 245-4 mother milk #74 24-34 #66 234-4 #60 Isomer profiles of TeCB
236-34 245-25 #101 PCB product 236-25 #110 #118 #95 245-24 #105 #99 245-34 mother milk #118 245-24 #99 234-34 #105 Isomer profiles of PeCB
#153 236-245 PCB product 245-245 #149 234-245 #138 #153 mother milk 245-245 234-245 #138 Isomer profiles of HxCB
#180 PCB product 245-2345 245-2356 #187 234-2345 #170 #180 breast milk 245-2345 245-2356 #187 234-2345 #170 Isomer profiles of HpCB
#28 #28 Tri-CBs 24-4 #31 Tetra-CBs #74 #74 245-4 #80 Penta-CBs #99 #118 245-34 #118 #99 245-24 #153 Hexa-CBs 245-234 #153 245-245 #138 #163/ #164 #138 Hepta-CBs #187 #180 #187 245-2345 #180 245-2356 #170 Chromatogram of PCB in human blood(3~7Cl) Hirai et al, (2003) Organohalogen compounds
(n=24) Congeners Mean 2S.D. ± Existence Ratio* (BZ#) (ng /g-lipid) (%) #153 28.0 28.0 22.3 ± #180 14.9 16.6 11.8 ± #138 10.4 9.2 8.3 ± #187 8.3 8.5 6.6 ± #118 6.9 5.9 5.5 ± #163,164 6.4 6.2 5.1 ± #99 4.7 4.2 3.8 ± #74 4.6 2.6 3.6 ± #146 4.1 3.7 3.3 ± #170 3.8 4.1 3.0 ± #156 2.8 3.0 2.3 ± Sum 75.6 * Mean is compare to total PCBs level Levels of the predominant PCB congeners in human blood cumulative (%) 22.3 34.1 42.4 49.0 54.5 59.6 63.4 67.0 70.3 73.3 75.6 245-245 245-2345 245-234 245-2356 245-34 245-24 245-4 245-235 2345-234 2345-34 Hirai et al, (2003) Organohalogen compounds
human milk/adipose tissue #153 (2,2',4,4',5,5'-) #74 (2,4,4',5-) #138 (2,2',3,4,4',5'-) #99 (2,2’,4,4',5-) #187 (2,2',3,4’,5,5’,6-) #118 (2,3’,4,4',5-) PCB congeners predominant in human samples
0.1-10ng/m3 0.1-10ng/L Air Water Sediment Biota 0.1-800ng/g-wet 0.05-800ng/g-dry PCB levels in air, water, sediment and biota (2002, MOE Japan)
50 45 abundance(%) 40 35 30 25 20 15 10 5 0 Air Human blood Water Breast milk Bird
Congener profiles of TrCB,TeCBin human and combustion sample (A)
PCB product PCB product Combustion Combustion Breast milk Breast milk PCB congeners predominant in human samples (TrCB, TeCB)
(stack gas) #47 TrCB 24-24 #68 #51 TeCB 24-35 24-26
12 DL-PCB(TEF)+di-ortho-PCB Predominant PCB in product Contribution of DL-PCBs in breast milk