Download
1 / 35
350 likes | 451 Views
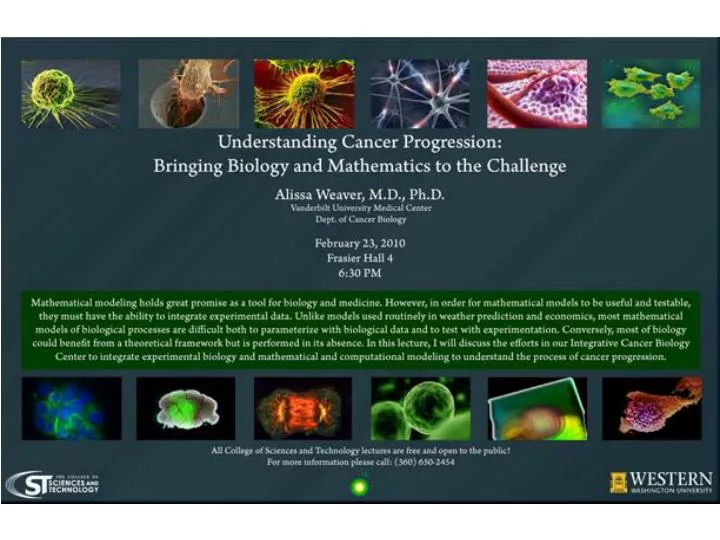
Feb 23, 2010 18:30-20:30 - Sigma Xi-CST lecture, Fraser 4 - Understanding Cancer Progression: Bringing Biology and Mathematics to the Challenge Alyssa Weaver. Exam W 2/24 6-8 pm. Review W afternoon?. Isotopic Tests: Generation of specifically labeled OAA. +CoASH CH 3. CH 3 -. COO -.

E N D
Feb 23, 2010 18:30-20:30 - Sigma Xi-CST lecture, Fraser 4 - Understanding Cancer Progression: Bringing Biology and Mathematics to the Challenge Alyssa Weaver Exam W 2/246-8 pm Review W afternoon?
Isotopic Tests: Generation of specifically labeled OAA
+CoASH CH3 CH3- COO- C=O CoASH When in the TCA cycle would this label be lost as CO2?
Table 21-2 Standard Free Energy Changes (DG°¢) and Physiological Free Energy Changes (DG) of Citric Acid Cycle Reactions. Page 790
Figure 21-26 Amphibolic functions of the citric acid cycle. Page 793
Chapter 22: Electron Transport and Oxidative Phosphorylation
OH- carbanion • E + H+ + Fum EH+ + Fum▪OH-E ▪ H+ ▪Mal- 18O exchange E + H+ + Mal
Figure 22-1 The sites of electron transfer that form NADH and FADH2 in glycolysis and the citric acid cycle. Page 798
Figure 22-2a Mitochondria. (a) An electron micrograph of an animal mitochondrion. Page 799
Figure 22-2b Mitochondria. (b) Cutaway diagram of a mitochondrion. Page 799
Figure 22-3 Freeze-fracture and freeze-etch electron micrographs of the inner and outer mitochondrial membranes. Page 799
Figure 22-9 The mitochondrial electron-transport chain. Page 803
Table 22-1Reduction Potentials of Electron-Transport Chain Components in Resting Mitochondria. Page 806
Table 22-1 (continued) Reduction Potentials of Electron-Transport Chain Components in Resting Mitochondria. Page 806
Table 22-1 (continued) Reduction Potentials of Electron-Transport Chain Components in Resting Mitochondria. Page 806
Table 22-1 (continued) Reduction Potentials of Electron-Transport Chain Components in Resting Mitochondria. Page 806
Figure 22-11 Effect of inhibitors on electron transport. Page 805
Figure 22-12 Electron micrographs of mouse liver mitochondria. (a) In the actively respiring state. (b) In the resting state. Page 806
Figure 22-13 Determination of the stoichiometry of coupled oxidation and phosphorylation (the P/O ratio) with different electron donors. Page 807
Figure 22-14The mitochondrial electron-transport chain. Page 808
Figure 22-15 Structures of the common iron–sulfur clusters. (a) [Fe–S] cluster. (b) [2Fe–2S] cluster. (c)[4Fe–4S] cluster. Page 808
Figure 22-17 Oxidation states of the coenzymes of complex I. (a) FMN. (b) CoQ. Page 810
Figure 22-20 Active site interactions in the proposed mechanism of the QFR-catalyzed reduction of fumarate to succinate. Page 812
Figure 22-21a Visible absorption spectra of cytochromes. (a) Absorption spectrum of reduced cytochrome c showing its characteristic a, b, and g (Soret) absorption bands. Page 813
Figure 22-21Visible absorption spectra of cytochromes.(b) The three separate a bands in the visible absorption spectrum of beef heart mitochondrial membranes (below) indicate the presence of cytochromes a, b, and c. Page 813
Figure 22-22a Porphyrin rings in cytochromes. (a) Chemical structures. Page 813
Figure 22-22b Porphyrin rings in cytochromes. (b) Axial liganding of the heme groups contained in cytochromes a, b, and c are shown. Page 813
Figure 22-25c X-Ray structure of fully oxidized bovine heart cytochrome c oxidase. (c) A protomer viewed similarly to Part a showing the positions of the complex’s redox centers. Page 816
Figure 22-28 Proposed reaction sequence for the reduction of O2 by the cytochrome a3–CuB binuclear complex of cytochrome c oxidase. Page 819
Figure 22-29 Coupling of electron transport (green arrow) and ATP synthesis. Page 821