Download
1 / 11
110 likes | 311 Views
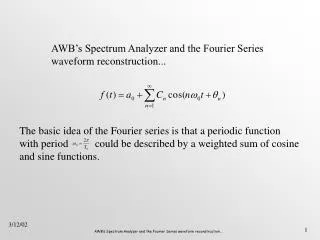
AWB’s Spectrum Analyzer and the Fourier Series waveform reconstruction. The basic idea of the Fourier series is that a periodic function with period could be described by a weighted sum of cosine and sine functions. The Spectrum Analyzer is an advance analysis tool in AWB.

E N D
AWB’s Spectrum Analyzer and the Fourier Series waveform reconstruction... The basic idea of the Fourier series is that a periodic function with period could be described by a weighted sum of cosine and sine functions.
The Spectrum Analyzer is an advance analysis tool in AWB. Initial window, each channel hardwired to the Oscilloscope. The Spectrum Analyzer is hardwired to the Oscilloscope. Set the markers in the oscilloscope to bound one complete cycle of the waveform of interest. Click here to do a DFT.
The DFT requires evenly spaced samples. Data points must be interpolated in some cases. The Spectrum Analyzer allows you to increase the frequency resolution without increasing time via two types of extrapolation. Use “Linear” for jagged waveforms and “Cubic Spline” for rounded waveforms for interpolation. Select “Repeat Data” for periodic waveforms and “Zero Pad” for single events.
The frequency resolution is the inverse of the simulation period. Max Frequency determine how finely the input waveform will be sampled. Pick the number of repetitions desired. The interval between points is inversely proportional to the maximum frequency.
Each channel of the Spectrum Analyzer is hard wired to the Oscilloscope. For the vertical display set to “Linear” and for Complex select either magnitude or phase. When you want both magnitude and phase on a waveform you should dedicate two channels in the oscilloscope to measure the same waveform. Then in the Spectrum Analyzer set one channel to measure magnitude and the other to measure phase.
Output waveform Consider this example on using the Spectrum Analyzer and reconstruction of the time domain waveform ... Input waveform
Here is the resulting DFT for the output waveform. Only the DC and first four harmonics seem significant. Set the Markers to the frequencies of interest. Magnitude and phase at 800Hz Magnitude and phase at 600Hz DC Component Magnitude and phase at 200Hz Magnitude and phase at 400Hz
However, a problem exists in the DFT results ... Both magnitude and phase are wrong... Hi Andy, Derek assigned SR 31903762 to me. This one discusses the DFT in relation to the time delay on the V_SINUSOIDAL parts. First, your conclusion is correct that the phase is -ve of what you expect. In fact, the transient waveform for the impulse generator is "flipped". The reason for this lies in the equation that Spice Plus (and also PSpice) uses for the SIN independent source: V = Voff + Vamp*sin(2*PI*(freq*(TIME-td)+phase/360)) This equation has both a "phase" and a "td" (time-delay) input. The V_SINUSOIDAL part in AWB, however, only includes a time delay parameter ("td"). When using "td", it is necessary to define it in terms of phase as : td = -phase/(360*frequency) This is the -ve of the definition that I found in the testcase that was sent. Brian
Using a summer and sine wave generators the filtered output waveform can be reconstructed using the DC component and first four harmonics... If this approach is used then you must make sure that all the sine waves have started at t=0.
Or using a profile model the filtered output waveform can be reconstructed using the DC component and first four harmonics... This approach only requires a conversions to be made to radians and radians/second.
It is also possible to create a profile subcircuit which will allow add exactly what appears in the Spectrum Analyzer for magnitude, phase and frequency... Either approach could be placed in a subcircuit model which could adjust the DFT results as needed to produce the corrected reconstructed waveform...