Download
1 / 13

E N D
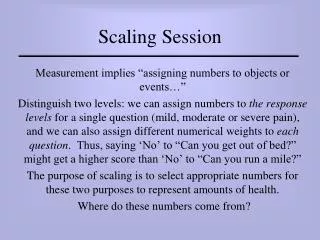
Scaling Session Measurement implies assigning numbers to objects or events. In our case, the numbers “weight” responses to questions, so that saying “Yes” to a question on being able to walk out of doors will receive a particular numerical score, instead of merely counting as one “Yes” reply. Where do these numbers come from?
Where Do the Weights Come From? • You can assign arbitrary weights • You can estimate weights from a judgment task • Copy them from the literature • Measure weights through a scaling task; scaling is concerned with how to select appropriate numbers to represent amounts of health • Infer weights from administrative, legal, or social decisions
Scaling • Most weights come from scaling tasks • Scaling is undertaken by people who are asked to perform a scaling task; this measures their preferences for specified health states • These preferences can be divided into values and utilities • Two contrasting historical traditions have influenced the way we assign numbers in health measurement: psychometrics and econometrics
Scaling (cont’d) • Psychometrics deals with feelings and perceptions, and is appropriate in judging single items; it measures values. • The econometric tradition derives from studies of consumption and choice between goods, so focuses on making decisions under conditions of uncertainty; it measures choice given risk. • “Utilities are the numbers that represent the strength of a person’s preferences for particular outcomes when faced with uncertainty” (George Torrance)
Psychometrics vs. Econometrics • Hence the econometric approach is suitable for weighting health states for clinical decision analysis and the patient’s choice of therapy, planning care & anything to do with future health around which there is uncertainty. • The psychometric approach is good for valuing current health states. • In general, utility scores are higher than value judgments
Psychometric Rating Tasks Many variants. For example: • Thurstone “equal-appearing interval scaling.” Cards with descriptions of health states (the items) written on each; raters place these on scale representing intensity of the relevant concept (e.g., disability). Typically 15 spaces on scale; item weights from median of individual judgments. High SD suggests ambiguous item • Magnitude estimation. Raters compare the health states with a standard state and are asked to provide a number or ratio indicating how much worse or better each is than the standard.
Econometric Rating Tasks • Standard Gamble. Respondent chooses between certain outcome (e.g., living in the restricted health state for 10 years and then dying) and a gamble (e.g., 90% chance of immediate cure, but with a 10% chance of immediate death). The more severely they judge the current state, the higher the risk of death they will accept to avoid it. • Time trade-off. Respondent asked to imagine being in the health state and is then asked how many years of life hw will give up to be cured from it.
Weights from Empirical Data Collection Psychometric • Paired comparisons method • Equal-appearing interval scaling • Likert scaling • Magnitude estimation methods Utility Methods • Standard gamble • Time tradeoff • Willingness to pay
Steps in Deriving Empirical Weights • Choose people to make the judgments • Choose the health states to be rated • Select a preference measurement method • Collect the preference judgments • Analyze the results and assign weights to each health state
Example of Calculating Likert Scale * Half p for that category plus p for category below
Guttman Scaling 1 2 3 4 5 6 I can run a mile TX X X X X I can do the grocery shopping T T X X X X I can walk one block TT TX X X I can rise from an armchair TT T T X X I can use the toilet without assistance T T T T T X score 5 4 3 2 1 0
Some Scaling Issues to Ponder • Is it worth the effort? The weighted and unweighted versions of many health measures often correlate +0.90 and over. • The overall score in any scale is weighted by number of items included in each sub-section. • Think about unidimensionality. Is “independence” unidimensional? • Sensibility of overall scores: should we add incontinence to mobility? • Is Hi + Lo equivalent to Med + Med?
Thoughts… • Note that numerical ratings can represent many different aspects of a health state: • occurrence of an attribute (e.g., symptom) • probability it will occur • undesirability of the attribute • utility (or undesirability, given its probability) • Do interval scales represent conceptually equal intervals?