Download
1 / 35
390 likes | 729 Views
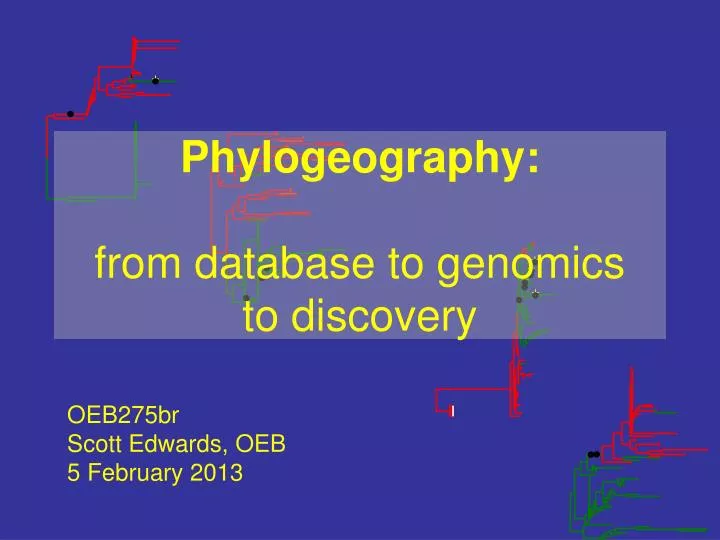
+. +. +. +. +. Phylogeography: from database to genomics to discovery. OEB275br Scott Edwards, OEB 5 February 2013. Systematics -- revealing the sequence of ancestry and descent. Taxonomy -- how we organize life’s diversity. Phylogenetic tree. Biogeography --

E N D
+ + + + + Phylogeography:from database to genomics to discovery OEB275br Scott Edwards, OEB 5 February 2013
Systematics -- revealing the sequence of ancestry and descent Taxonomy -- how we organize life’s diversity Phylogenetic tree Biogeography -- the distribution of life on earth Process: what are the rules of biodiversification? common ancestors
Cell Nucleus Mitochondria • Mitochondrial DNA • Small & circular molecule • Maternally inherited • Fast-changing • No recombination • Nuclear DNA • Large & linear molecule • Biparentally inherited • Slower evolution • No recombination Two types of molecular tools forphylogenetic studies
Overview of a bird mitochondrial genome (~17,000 bp) Glu noncoding NADH6 Pro Phe 12s rRNA Val Control Region 16s rRNA Thr Cyt b NADH1 Leu Ile Gln Met NADH5 NADH2 Leu Trp rRNA genes Ser Ala tRNA genes His Asn COI NADH4 Cys ATP synthase genes Ser Asp NADH3 NADH4L Tyr Cytochrome Oxidase COII Lys Gly ATP6 ATP8 Arg COIII Cytochrome bc1 complex NADH:Ubiquinone Oxidoreductase
Case studies Gray-crowned Babblers (Pomatostomus temporalis) Red-backed Wren (Malurus melanocephalus) June Lee Grassfinches (Poephila) W. Bryan Jennings Zebra Finches (Taenopygia guttata) Chris Balakrishnan
Mitochondrial gene tree for grey-crowned babblers rubeculus temporalis New Guinea Cape York Pilbara Top End Southeast Central East Sampling localities for grey-crowned babblers Carpentarian barrier Edwards, S. V. (1993) Proc. R. Soc. Lond. B252, 177-185.
Gene flow erodes population monophyly Migration event reconstructed by parsimony
Museum collections are archives ofenvironmental history Hawaiian Honeycreepers (Drepanididae)
Traditional specimens Genetic Resources Drawings, photographs, field notes
Database search for available genetic resources for…. Malurus melanocephalus, the Red-backed Fairy Wren
Diversity of Australo-Papuan Fairy Wrens -Maluridae Superb Fairywren (Malurus) Splendid Fairywren (Malurus) Southern Emu-wren (Stipiturus) Striated Grasswren (Amytornis)
Multiple genes resolve the phylogenetic tree for Fairy Wrens Lee, Joseph, & Edwards 2012. Syst. Biol. 61:253-271.
Red-backed Fairy wren - discordant subspecies boundaries B Arnheim Land (AL) Cape York (CY) Kimberley Plateau (KP) Atherton Plateau (AP) A D Eastern Forests (EF) E B Modified from Cracraft Evolution 40: 977-996
Genetic Diversity among loci - Introns Anonymous loci
Estimating genetic diversity () within populations “Watterson’s theta” Allele 1: ACTGGCTGAACTT Allele 2: ACTGGTTGAACTT Allele 3: GCTGGTTGAACCT * * * S=3 = = a function of the number of polymorphic sites in a population (S) n = number of alleles
A second estimate of 4Nm Allele 1: ACTGGCTGAACTT Allele 2: ACTGGTTGAACTT Allele 3: GCTGGTTGAACCT k = number of differences between pairs of alleles i and j n = number of alleles
Simple demographic models of Australian birds Balakrishnan et al. 2010. Pp. 65-88 In: In Search of the Causes of Evolution: From Field Observations to Mechanisms. (Eds., Peter and Rosemary Grant), Princeton University Press, Princeton, NJ.
Testing neutrality Tajima’s D statistic proportional to: Under neutrality, Tajima’s D ≈ 0
Testing neutrality Under directional selection, Tajima’s D < 0
1.0 0.8 0.6 0.4 0.2 0.0 Population assignment using ‘Structure’
High-resolution geolocation using human SNPs Novembre et al. 2008. Nature 456, 98-101
Positive Selection Neutral evolution Phylogenetic manifestations of natural selection Edwards 2009 PNAS 106:8799-8800
Extraordinary Sperm Production In Fairy Wrens
Transcriptomics: Higher diversity of genes in breeding vs. non-breeding season testes All Year Round 5,809 Contigs Non-Breeding Season Breeding Season 2,062 Contigs 10,284 Contigs
20 highly expressed genes specific to breeding season testis Red=genes showing dn/ds ratio > 1
Natural selection? examples of genes showing reciprocal monophyly among Fairy Wren species Outer Dense Fiber Protein Proacrosin
Gene tree monophyly as an indicator of natural selection European corn borer