Download
1 / 24
240 likes | 329 Views
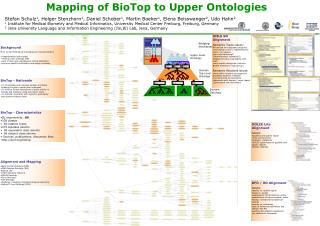
DETECTION OF UPPER LEVEL TURBULENCE VIA GPS OCCULTATION METHODS. Larry Cornman National Center for Atmospheric Research USA. Turbulence is a significant operational problem. 1983-1997 accident statistics in US 1,438 injuries 609 fatalities (mainly GA, only 1 commercial)

E N D
DETECTION OF UPPER LEVEL TURBULENCE VIA GPS OCCULTATION METHODS Larry Cornman National Center for Atmospheric Research USA
Turbulence is a significant operational problem • 1983-1997 accident statistics in US • 1,438 injuries • 609 fatalities (mainly GA, only 1 commercial) • 70% (commercial) of weather related accidents • Cost to U.S. airlines alone exceeds $135M USD/year • Only 35% were forecast! • 1999: severe encounters = 6288, extreme = 16
Turbulence Scales of Motion “Turbulent” eddies Large eddies Small eddies 10’s km cm Aircraft responds to scales from few m – few km energy cascade Energy turbulence no turbulence Mesoscalemodelresolution NWPresolution 1 eddy size
Turbulence Detection And Forecasting:Past Approaches Current Observation System --Voice Pilot Reports (PIREP’s) • Currently, the only source of real-time observations • Inadequate spatial and temporal accuracy • Not all pilots report • Lack of null reports • Subjective measure • Dissemination of turbulence information is poor
Turbulence Detection And Forecasting:Past Approaches Current Advisory and Warning System - Airmets & Convective SigMets • Human-generated product • Gives an overly broad picture in both time and space • Better dissemination of information is required
GPS-Turbulence Feasibility Efforts Is there “signal in the signal”? or: What is one person’s noise is another’s signal… GPS/MET occultation through turbulence?
Theoretical Background • As a microwave signal passes through a field with fluctuating index of refraction, the signal amplitude and phase will also fluctuate – proportional to the fluctuating field. • Scattering theory tells us the form of the proportionality – given a set of assumptions.
Theoretical Background, cont’d • Assumptions: • The effects of ray bending are negligible. • The turbulence is isotropic on the spatial scales of interest. • The transmitter and receiver velocities are constant over the sampling time. • Weak scattering theory is applicable. • Ionospheric and attenuation effects are negligible.
Problem Geometry R is the distance from the GPS to the LEO, and z1is the distance from the GPS to the turbulence.
Theoretical amplitude frequency spectrum in the coordinate system of the GPS. (Phase spectrum is very similar.) Where, the effective velocity is:
A phase screen approximation is used for the input spectrum: is the spectrum of the index of refraction fluctuations. Using a von Karman spectrum gives: Where it is assumed that the turbulence is only contained in a region in length
Therefore, the proportionality between the measured amplitude spectrum and the turbulence spectrum – given all the inherent assumptions – is: Where is the integral from above. The phase spectrum has a similar structure. The turbulence intensity information is contained in the term , which unfortunately is a function of the unknown size of the turbulent region.
GPS-Turbulence Feasibility Efforts • Using GPS/MET data to investigate the question. • Looking at data from upper troposphere, lower stratosphere: • Negligible humidity effects. • Altitude of commercial transport aircraft in cruise. • Analyzing short segments of measured, detrended amplitude (SNR) and phase time series and comparing to theory.
Occultation 546 : Amplitude and Phase Spectra, measured and model.
Occultation 546 : Amplitude and Phase Structure Functions, measured and model.
Occultation 586 : Amplitude and Phase Spectra, measured and model.
Occultation 586 : Amplitude and Phase Structure Functions, measured and model.
Occultation 641 : Amplitude and Phase Spectra, measured and model.
Occultation 641 : Amplitude and Phase Structure Functions, measured and model.
Summary and Future Work • Occultation data from GPS-MET is consistent with theoretical turbulence and scattering models – especially amplitude data. • More cases will be analyzed; issues with phase will be investigated. • Fine-scale numerical modeling and GPS signal simulation will be used to look into: • The effect of shear layers on turbulence estimation. • Investigate the relationship between index of refraction fluctuations and velocity fluctuations.