Download
1 / 56
560 likes | 726 Views
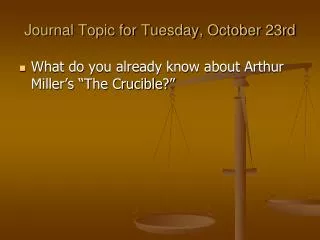
Tuesday, October 23rd. AGENDA: 1 – Bell Ringer 2 – Phase Change Diagrams 3 – Exit Ticket Announcements 2.5 pts of extra credit for coming for tutoring after school (up to 5 times / week). Today’s Goal: Students will be able to read a phase change diagram. Homework

E N D
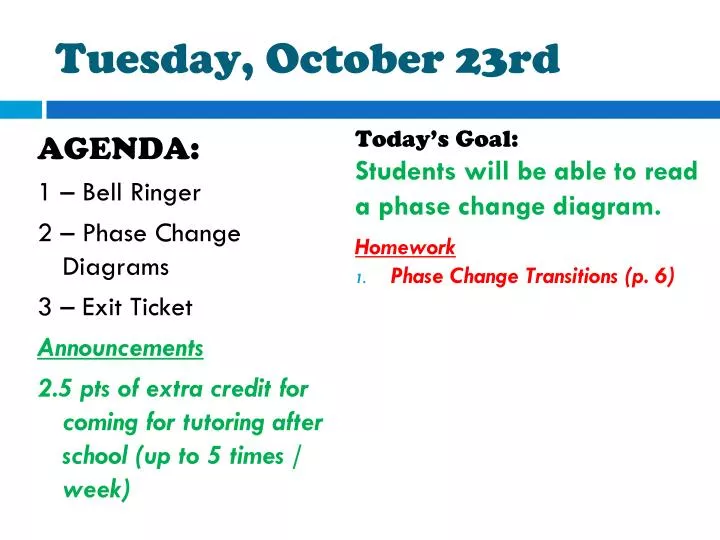
Tuesday, October 23rd AGENDA: 1 – Bell Ringer 2 – Phase Change Diagrams 3 – Exit Ticket Announcements 2.5 pts of extra credit for coming for tutoring after school (up to 5 times / week) Today’s Goal: Students will be able to read a phase change diagram. Homework • Phase Change Transitions (p. 6)
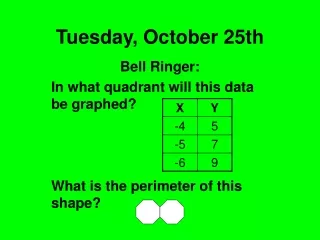
Tuesday, October 23rd Objective: Students will be able to read a phase change diagram. Bell Ringer(p. 13): • What is the phase change from liquid to solid? What about liquid to gas? • When something is melting, what phase(s) are present? Have your classroom materials out and packet open to page 3 for a stamp!
Tuesday, October 23rd Objective: Students will be able to read a phase change diagram. Bell Ringer(p. 13): • What is the phase change from liquid to solid? What about liquid to gas? • When something is melting, what phase(s) are present? Have your classroom materials out and packet open to page 3 for a stamp!
Tuesday, October 23rd Objective: Students will be able to read a phase change diagram. Bell Ringer(p. 13): • What is the phase change from liquid to solid? What about liquid to gas? • When something is melting, what phase(s) are present? Have your classroom materials out and packet open to page 3 for a stamp!
Tuesday, October 23rd Objective: Students will be able to read a phase change diagram. Bell Ringer(p. 13): • What is the phase change from liquid to solid? What about liquid to gas? • When something is melting, what phase(s) are present? Have your classroom materials out and packet open to page 3 for a stamp!
Tuesday, October 23rd Objective: Students will be able to read a phase change diagram. Bell Ringer(p. 13): • What is the phase change from liquid to solid? What about liquid to gas? • When something is melting, what phase(s) are present? Have your classroom materials out and packet open to page 3 for a stamp!
Tuesday, October 23rd Objective: Students will be able to read a phase change diagram. Bell Ringer(p. 13): • What is the phase change from liquid to solid? What about liquid to gas? • When something is melting, what phase(s) are present? Have your classroom materials out and packet open to page 3 for a stamp!
Tuesday, October 23rd Objective: Students will be able to read a phase change diagram. Bell Ringer(p. 13): • What is the phase change from liquid to solid? What about liquid to gas? • When something is melting, what phase(s) are present? Have your classroom materials out and packet open to page 3 for a stamp!
Tuesday, October 23rd AGENDA: 1 – Bell Ringer 2 – Phase Change Diagrams 3 – Exit Ticket Announcements 2.5 pts of extra credit for coming for tutoring after school (up to 5 times / week) Today’s Goal: Students will be able to read a phase change diagram. Homework • Phase Change Transitions (p. 6)
Shout Outs Period 1 – Dexter, Tahmera Period 2 – Anthony Period 3 – Ladonna, D’Angela
Homework Phase Change Transitions (p. 6)
Week 6 Weekly Agenda Monday 10/22 – Quiz 3 Review Tuesday 10/23 – Phase Change Diagrams Wednesday 10/24 – Metric System Thursday 10/25 – Metric System Lab Friday 10/26 – Quiz 5
CHAMPS for October 23rd C – Conversation – No talking unless directed H – Help – RAISE HAND for questions A – Activity – Take notes so you can understand phase change diagrams M – Materials and Movement – Pen/Pencil, Paper P – Participation – Write down notes, correct answers S – Success – Understand phase change diagrams!
Phase Change Notes Temperature – A measure of how much energy something has. Pressure – How much a surface is being pushed on. Atmospheric Pressure – How much Earth’s atmosphere pushes down on us (set as 1 atm).
Phase Change Diagrams (p. 4) Liquid Solid
Phase Change Diagrams (p. 4) Liquid Solid Gas
Questions (p. 4) 1. Which section represents the solid phase? ________ 2. What section represents the liquid phase? ________ 3. What section represents the gas phase? ________
Questions (p. 4) 1. Which section represents the solid phase? A 2. What section represents the liquid phase? C • What section represents the gas phase? B
Phase Change Diagrams (p. 4) Liquid Solid Triple Point Gas
Questions (p. 4) 4. What letter represents the triple point? In your own words, what is the definition of a triple point?
Questions (p. 4) 4. What letter represents the triple point? d In your own words, what is the definition of a triple point?
Questions (p. 4) 4. What letter represents the triple point? d In your own words, what is the definition of a triple point? The Temperature and Pressure where all 3 phases coexist.
Phase Change Diagrams (p. 4) Liquid Solid Triple Point Gas
Phase Change Diagrams (p. 4) Melting Liquid Solid Triple Point Gas
Phase Change Diagrams (p. 4) Melting Liquid Solid Boiling Triple Point Gas
Questions (p. 4) 5. What is this substance’s normal melting point, at 1 atmosphere of pressure? _________ 6. What is this substance’s normal boiling point, at 1 atmosphere of pressure? _________
Questions (p. 4) 5. What is this substance’s normal melting point, at 1 atmosphere of pressure? 60 C 6. What is this substance’s normal boiling point, at 1 atmosphere of pressure? 100 C
Phase Change Diagrams (p. 4) Melting Liquid Solid Boiling Triple Point Gas
Questions (p. 4) 7. Above what temperature is it impossible to liquefy this substance, no matter what the pressure? _____ 8. At what temperature and pressure do all three phases coexist? ___________________
Questions (p. 4) 7. Above what temperature is it impossible to liquefy this substance, no matter what the pressure? 110 C 8. At what temperature and pressure do all three phases coexist? Triple Point; 45 C, 0.5 atm
Phase Change Diagrams (p. 4) Melting Liquid Solid Boiling Triple Point Gas
Questions (p. 4) 9. At a constant temperature, what would you do to cause this substance to change from the liquid phase to the solid phase? 10 What does sublimation mean?
Questions (p. 4) 9. At a constant temperature, what would you do to cause this substance to change from the liquid phase to the solid phase? Increase Pressure; pushes molecules together 10 What does sublimation mean? Solid to gas transition; low Temperature, high Pressure
Phase Change Diagrams (p. 4) Melting Critical Point Liquid Solid Boiling Triple Point Gas
Cornell Notes: Lab Review During a phase change you have a mix of the two phases. Phase Changes are flat because they occur at a constant temperature Potential Energy increases during phase changes Kinetic Energy increases when Temperature increases Time
Lab Post-Lab Questions: 1. What does the line look like on your graph when temperature is changing? 2. What does the line look like when temperature is not changing? 3.What does the first flat region represent? What does the second flat region represent?
Lab Post-Lab Questions: 1. What does the line look like on your graph when temperature is changing? Goes up 2. What does the line look like when temperature is not changing? Flat 3.What does the first flat region represent? What does the second flat region represent? Melting, Boiling